Mexican vs Alsatian Seniors Poverty Over the Age of 65
COMPARE
Mexican
Alsatian
Seniors Poverty Over the Age of 65
Seniors Poverty Over the Age of 65 Comparison
Mexicans
Alsatians
13.1%
SENIORS POVERTY OVER THE AGE OF 65
0.0/ 100
METRIC RATING
279th/ 347
METRIC RANK
11.3%
SENIORS POVERTY OVER THE AGE OF 65
20.1/ 100
METRIC RATING
200th/ 347
METRIC RANK
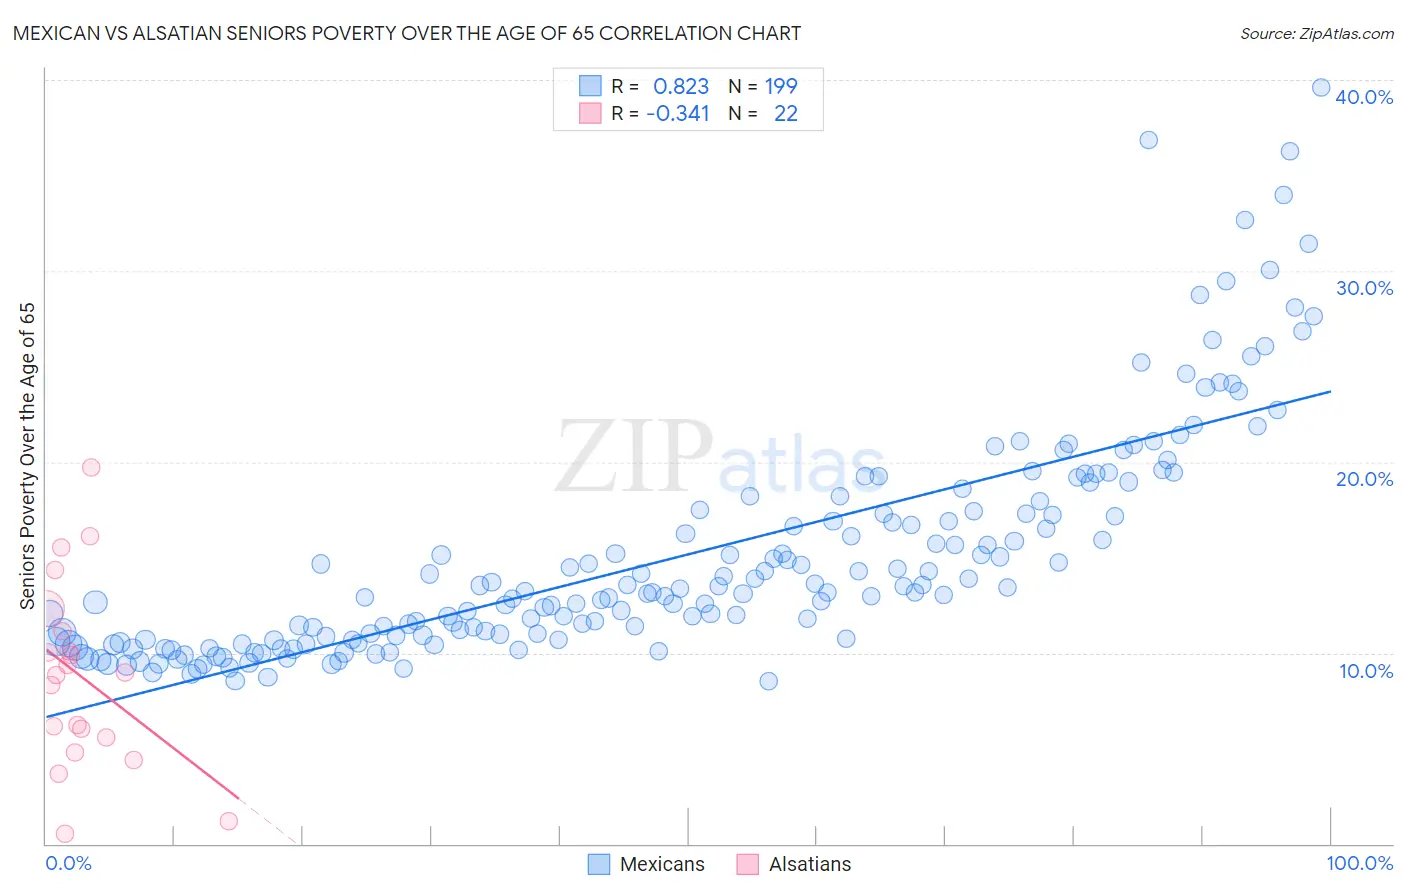
Mexican vs Alsatian Seniors Poverty Over the Age of 65 Correlation Chart
The statistical analysis conducted on geographies consisting of 560,231,144 people shows a very strong positive correlation between the proportion of Mexicans and poverty level among seniors over the age of 65 in the United States with a correlation coefficient (R) of 0.823 and weighted average of 13.1%. Similarly, the statistical analysis conducted on geographies consisting of 82,660,151 people shows a mild negative correlation between the proportion of Alsatians and poverty level among seniors over the age of 65 in the United States with a correlation coefficient (R) of -0.341 and weighted average of 11.3%, a difference of 16.0%.
Seniors Poverty Over the Age of 65 Correlation Summary
| Measurement | Mexican | Alsatian |
| Minimum | 8.5% | 0.52% |
| Maximum | 39.6% | 19.7% |
| Range | 31.1% | 19.2% |
| Mean | 15.1% | 8.8% |
| Median | 13.2% | 8.9% |
| Interquartile 25% (IQ1) | 10.7% | 5.6% |
| Interquartile 75% (IQ3) | 17.4% | 11.2% |
| Interquartile Range (IQR) | 6.7% | 5.6% |
| Standard Deviation (Sample) | 6.0% | 4.8% |
| Standard Deviation (Population) | 6.0% | 4.7% |
Similar Demographics by Seniors Poverty Over the Age of 65
Demographics Similar to Mexicans by Seniors Poverty Over the Age of 65
In terms of seniors poverty over the age of 65, the demographic groups most similar to Mexicans are Yuman (13.1%, a difference of 0.040%), Immigrants from Bahamas (13.0%, a difference of 0.16%), Immigrants from El Salvador (13.1%, a difference of 0.48%), Paiute (12.9%, a difference of 0.98%), and Immigrants from the Azores (12.9%, a difference of 1.1%).
| Demographics | Rating | Rank | Seniors Poverty Over the Age of 65 |
| Immigrants | Uruguay | 0.1 /100 | #272 | Tragic 12.8% |
| Kiowa | 0.0 /100 | #273 | Tragic 12.8% |
| Salvadorans | 0.0 /100 | #274 | Tragic 12.8% |
| Immigrants | Colombia | 0.0 /100 | #275 | Tragic 12.9% |
| Immigrants | Azores | 0.0 /100 | #276 | Tragic 12.9% |
| Paiute | 0.0 /100 | #277 | Tragic 12.9% |
| Immigrants | Bahamas | 0.0 /100 | #278 | Tragic 13.0% |
| Mexicans | 0.0 /100 | #279 | Tragic 13.1% |
| Yuman | 0.0 /100 | #280 | Tragic 13.1% |
| Immigrants | El Salvador | 0.0 /100 | #281 | Tragic 13.1% |
| Senegalese | 0.0 /100 | #282 | Tragic 13.3% |
| Central Americans | 0.0 /100 | #283 | Tragic 13.4% |
| Colville | 0.0 /100 | #284 | Tragic 13.5% |
| Guatemalans | 0.0 /100 | #285 | Tragic 13.5% |
| Immigrants | Senegal | 0.0 /100 | #286 | Tragic 13.6% |
Demographics Similar to Alsatians by Seniors Poverty Over the Age of 65
In terms of seniors poverty over the age of 65, the demographic groups most similar to Alsatians are Immigrants from Israel (11.3%, a difference of 0.020%), Immigrants from Burma/Myanmar (11.3%, a difference of 0.16%), Immigrants from Brazil (11.3%, a difference of 0.33%), Costa Rican (11.3%, a difference of 0.44%), and Immigrants from Zaire (11.3%, a difference of 0.46%).
| Demographics | Rating | Rank | Seniors Poverty Over the Age of 65 |
| Taiwanese | 29.2 /100 | #193 | Fair 11.2% |
| Chileans | 27.8 /100 | #194 | Fair 11.2% |
| Immigrants | Vietnam | 26.6 /100 | #195 | Fair 11.2% |
| Bangladeshis | 25.2 /100 | #196 | Fair 11.2% |
| Albanians | 24.4 /100 | #197 | Fair 11.2% |
| Immigrants | Burma/Myanmar | 21.3 /100 | #198 | Fair 11.3% |
| Immigrants | Israel | 20.3 /100 | #199 | Fair 11.3% |
| Alsatians | 20.1 /100 | #200 | Fair 11.3% |
| Immigrants | Brazil | 17.8 /100 | #201 | Poor 11.3% |
| Costa Ricans | 17.0 /100 | #202 | Poor 11.3% |
| Immigrants | Zaire | 16.9 /100 | #203 | Poor 11.3% |
| Israelis | 16.5 /100 | #204 | Poor 11.3% |
| Brazilians | 15.4 /100 | #205 | Poor 11.3% |
| Choctaw | 14.5 /100 | #206 | Poor 11.4% |
| Immigrants | Western Asia | 13.6 /100 | #207 | Poor 11.4% |