Mexican vs Alsatian In Labor Force | Age 20-64
COMPARE
Mexican
Alsatian
In Labor Force | Age 20-64
In Labor Force | Age 20-64 Comparison
Mexicans
Alsatians
77.2%
IN LABOR FORCE | AGE 20-64
0.0/ 100
METRIC RATING
305th/ 347
METRIC RANK
79.1%
IN LABOR FORCE | AGE 20-64
5.7/ 100
METRIC RATING
229th/ 347
METRIC RANK
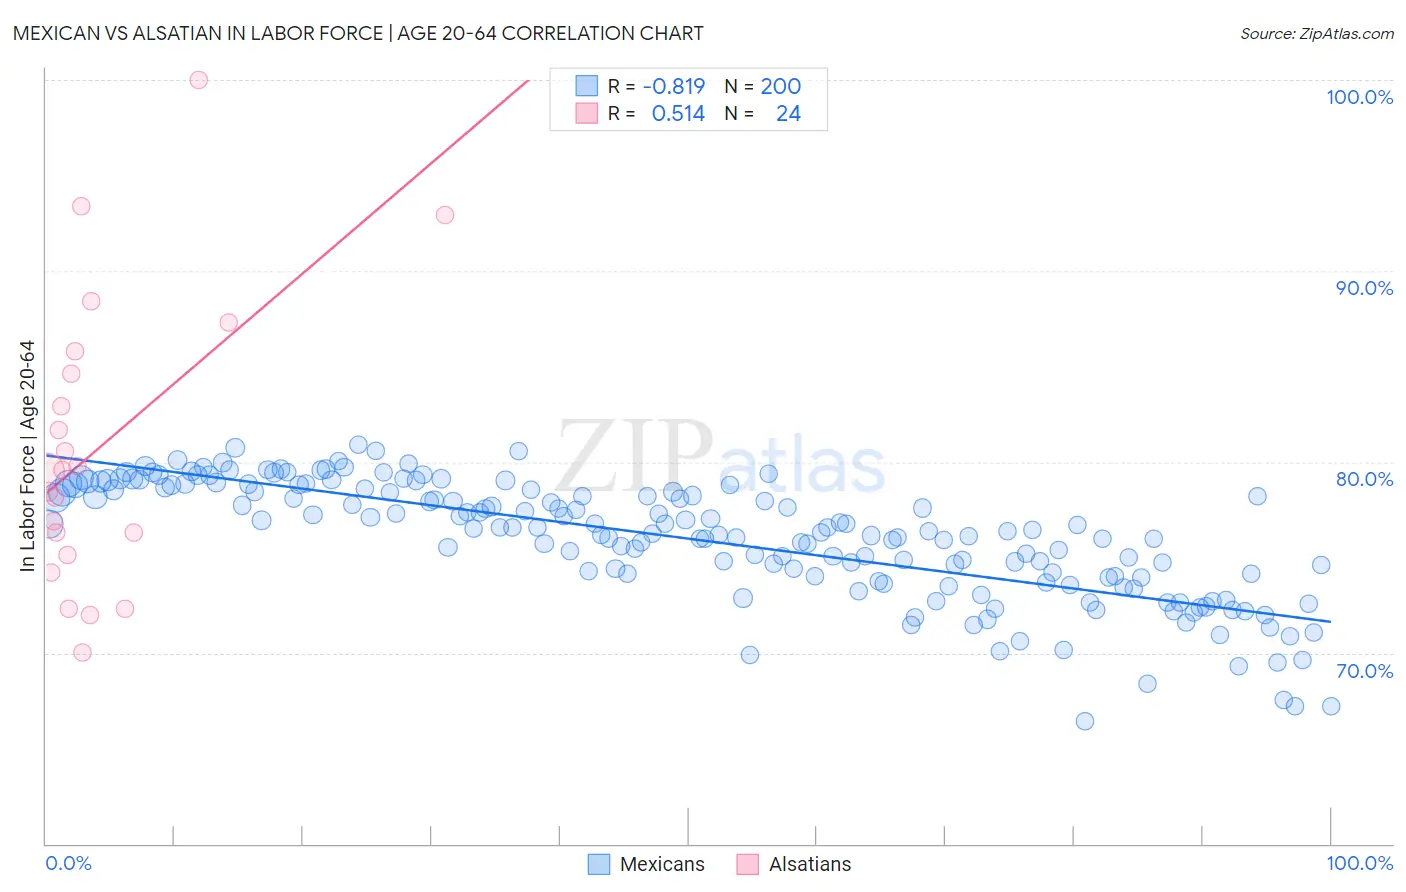
Mexican vs Alsatian In Labor Force | Age 20-64 Correlation Chart
The statistical analysis conducted on geographies consisting of 565,322,836 people shows a very strong negative correlation between the proportion of Mexicans and labor force participation rate among population between the ages 20 and 64 in the United States with a correlation coefficient (R) of -0.819 and weighted average of 77.2%. Similarly, the statistical analysis conducted on geographies consisting of 82,681,658 people shows a substantial positive correlation between the proportion of Alsatians and labor force participation rate among population between the ages 20 and 64 in the United States with a correlation coefficient (R) of 0.514 and weighted average of 79.1%, a difference of 2.4%.
In Labor Force | Age 20-64 Correlation Summary
| Measurement | Mexican | Alsatian |
| Minimum | 66.4% | 70.0% |
| Maximum | 80.9% | 100.0% |
| Range | 14.5% | 30.0% |
| Mean | 76.0% | 80.8% |
| Median | 76.5% | 79.6% |
| Interquartile 25% (IQ1) | 74.0% | 75.7% |
| Interquartile 75% (IQ3) | 78.6% | 85.2% |
| Interquartile Range (IQR) | 4.5% | 9.5% |
| Standard Deviation (Sample) | 3.1% | 7.5% |
| Standard Deviation (Population) | 3.1% | 7.4% |
Similar Demographics by In Labor Force | Age 20-64
Demographics Similar to Mexicans by In Labor Force | Age 20-64
In terms of in labor force | age 20-64, the demographic groups most similar to Mexicans are Potawatomi (77.2%, a difference of 0.020%), Immigrants from Mexico (77.3%, a difference of 0.040%), Chippewa (77.3%, a difference of 0.11%), Central American Indian (77.1%, a difference of 0.19%), and Alaska Native (77.0%, a difference of 0.25%).
| Demographics | Rating | Rank | In Labor Force | Age 20-64 |
| Cree | 0.0 /100 | #298 | Tragic 77.7% |
| Hispanics or Latinos | 0.0 /100 | #299 | Tragic 77.6% |
| Spanish American Indians | 0.0 /100 | #300 | Tragic 77.6% |
| Nepalese | 0.0 /100 | #301 | Tragic 77.5% |
| Iroquois | 0.0 /100 | #302 | Tragic 77.5% |
| Chippewa | 0.0 /100 | #303 | Tragic 77.3% |
| Immigrants | Mexico | 0.0 /100 | #304 | Tragic 77.3% |
| Mexicans | 0.0 /100 | #305 | Tragic 77.2% |
| Potawatomi | 0.0 /100 | #306 | Tragic 77.2% |
| Central American Indians | 0.0 /100 | #307 | Tragic 77.1% |
| Alaska Natives | 0.0 /100 | #308 | Tragic 77.0% |
| Americans | 0.0 /100 | #309 | Tragic 77.0% |
| Comanche | 0.0 /100 | #310 | Tragic 77.0% |
| Blackfeet | 0.0 /100 | #311 | Tragic 77.0% |
| Alaskan Athabascans | 0.0 /100 | #312 | Tragic 76.9% |
Demographics Similar to Alsatians by In Labor Force | Age 20-64
In terms of in labor force | age 20-64, the demographic groups most similar to Alsatians are Panamanian (79.1%, a difference of 0.0%), Native Hawaiian (79.1%, a difference of 0.0%), Central American (79.1%, a difference of 0.010%), Immigrants from Western Europe (79.1%, a difference of 0.010%), and Portuguese (79.1%, a difference of 0.020%).
| Demographics | Rating | Rank | In Labor Force | Age 20-64 |
| Immigrants | Panama | 6.9 /100 | #222 | Tragic 79.1% |
| Canadians | 6.8 /100 | #223 | Tragic 79.1% |
| Immigrants | Uzbekistan | 6.8 /100 | #224 | Tragic 79.1% |
| Portuguese | 6.4 /100 | #225 | Tragic 79.1% |
| Central Americans | 5.9 /100 | #226 | Tragic 79.1% |
| Immigrants | Western Europe | 5.9 /100 | #227 | Tragic 79.1% |
| Panamanians | 5.7 /100 | #228 | Tragic 79.1% |
| Alsatians | 5.7 /100 | #229 | Tragic 79.1% |
| Native Hawaiians | 5.6 /100 | #230 | Tragic 79.1% |
| Lebanese | 5.1 /100 | #231 | Tragic 79.1% |
| Guamanians/Chamorros | 4.5 /100 | #232 | Tragic 79.1% |
| Japanese | 4.0 /100 | #233 | Tragic 79.1% |
| Immigrants | Canada | 3.2 /100 | #234 | Tragic 79.0% |
| Tlingit-Haida | 3.2 /100 | #235 | Tragic 79.0% |
| Samoans | 2.9 /100 | #236 | Tragic 79.0% |