Menominee vs Immigrants from Peru Poverty
COMPARE
Menominee
Immigrants from Peru
Poverty
Poverty Comparison
Menominee
Immigrants from Peru
16.4%
POVERTY
0.0/ 100
METRIC RATING
322nd/ 347
METRIC RANK
11.9%
POVERTY
81.1/ 100
METRIC RATING
140th/ 347
METRIC RANK
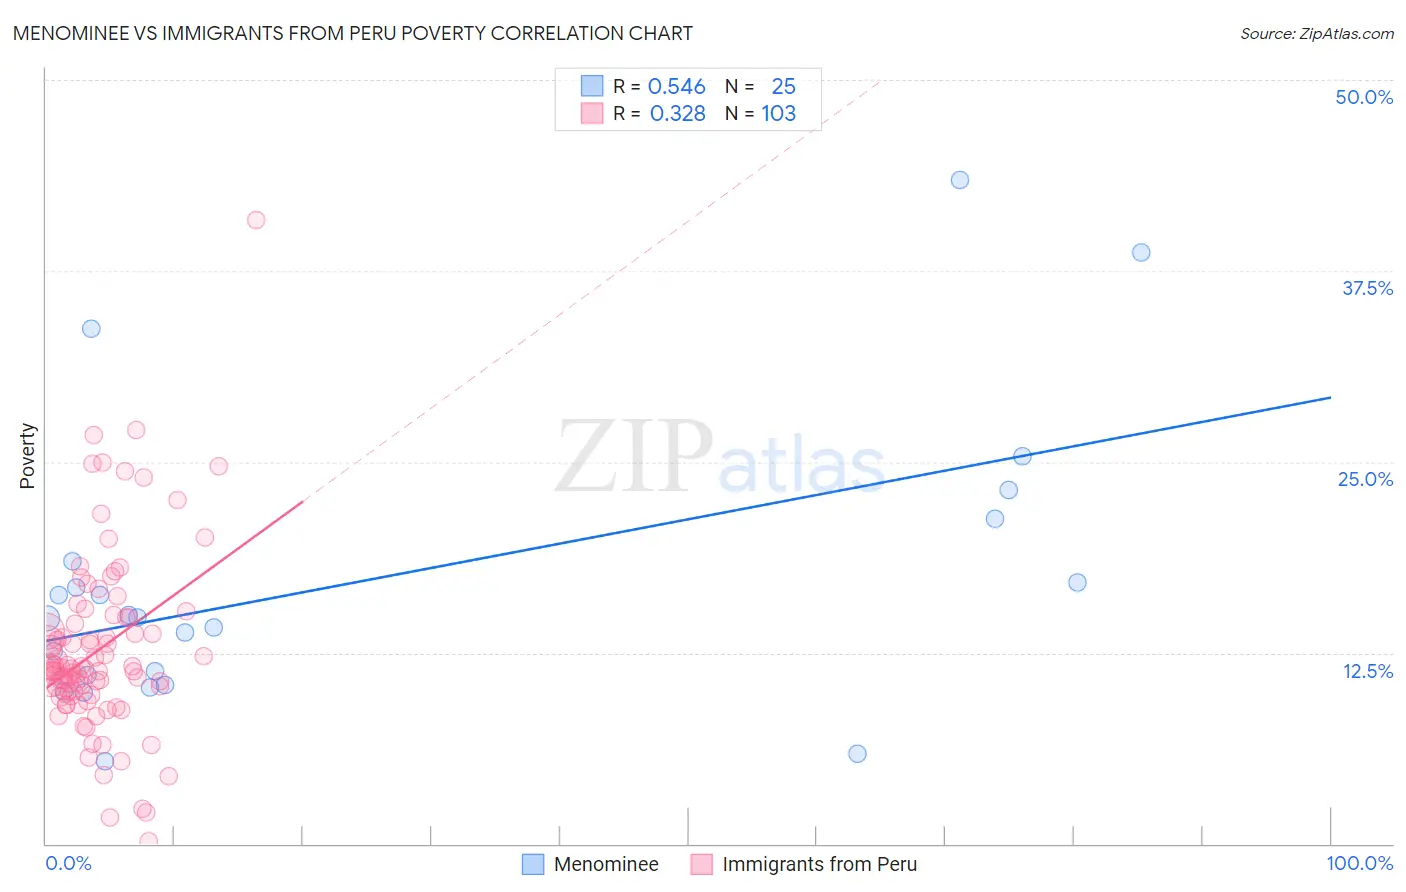
Menominee vs Immigrants from Peru Poverty Correlation Chart
The statistical analysis conducted on geographies consisting of 45,777,730 people shows a substantial positive correlation between the proportion of Menominee and poverty level in the United States with a correlation coefficient (R) of 0.546 and weighted average of 16.4%. Similarly, the statistical analysis conducted on geographies consisting of 328,758,820 people shows a mild positive correlation between the proportion of Immigrants from Peru and poverty level in the United States with a correlation coefficient (R) of 0.328 and weighted average of 11.9%, a difference of 38.4%.
Poverty Correlation Summary
| Measurement | Menominee | Immigrants from Peru |
| Minimum | 5.4% | 0.14% |
| Maximum | 43.5% | 40.8% |
| Range | 38.1% | 40.7% |
| Mean | 17.2% | 12.7% |
| Median | 14.8% | 11.4% |
| Interquartile 25% (IQ1) | 10.7% | 9.8% |
| Interquartile 75% (IQ3) | 19.9% | 14.8% |
| Interquartile Range (IQR) | 9.2% | 5.0% |
| Standard Deviation (Sample) | 9.5% | 5.9% |
| Standard Deviation (Population) | 9.3% | 5.9% |
Similar Demographics by Poverty
Demographics Similar to Menominee by Poverty
In terms of poverty, the demographic groups most similar to Menominee are Colville (16.6%, a difference of 0.75%), Arapaho (16.3%, a difference of 0.96%), Yakama (16.7%, a difference of 1.3%), Central American Indian (16.7%, a difference of 1.5%), and Immigrants from Honduras (16.2%, a difference of 1.7%).
| Demographics | Rating | Rank | Poverty |
| British West Indians | 0.0 /100 | #315 | Tragic 15.9% |
| Hondurans | 0.0 /100 | #316 | Tragic 15.9% |
| U.S. Virgin Islanders | 0.0 /100 | #317 | Tragic 16.1% |
| Immigrants | Dominica | 0.0 /100 | #318 | Tragic 16.1% |
| Immigrants | Congo | 0.0 /100 | #319 | Tragic 16.1% |
| Immigrants | Honduras | 0.0 /100 | #320 | Tragic 16.2% |
| Arapaho | 0.0 /100 | #321 | Tragic 16.3% |
| Menominee | 0.0 /100 | #322 | Tragic 16.4% |
| Colville | 0.0 /100 | #323 | Tragic 16.6% |
| Yakama | 0.0 /100 | #324 | Tragic 16.7% |
| Central American Indians | 0.0 /100 | #325 | Tragic 16.7% |
| Paiute | 0.0 /100 | #326 | Tragic 16.7% |
| Kiowa | 0.0 /100 | #327 | Tragic 16.8% |
| Ute | 0.0 /100 | #328 | Tragic 16.9% |
| Blacks/African Americans | 0.0 /100 | #329 | Tragic 17.3% |
Demographics Similar to Immigrants from Peru by Poverty
In terms of poverty, the demographic groups most similar to Immigrants from Peru are Immigrants from France (11.9%, a difference of 0.090%), Basque (11.9%, a difference of 0.11%), Pakistani (11.9%, a difference of 0.19%), Immigrants from Jordan (11.9%, a difference of 0.22%), and Brazilian (11.9%, a difference of 0.22%).
| Demographics | Rating | Rank | Poverty |
| Immigrants | Western Europe | 85.2 /100 | #133 | Excellent 11.8% |
| Yugoslavians | 85.2 /100 | #134 | Excellent 11.8% |
| Immigrants | Vietnam | 85.2 /100 | #135 | Excellent 11.8% |
| Chileans | 84.2 /100 | #136 | Excellent 11.8% |
| Immigrants | Switzerland | 83.0 /100 | #137 | Excellent 11.8% |
| Immigrants | Jordan | 82.4 /100 | #138 | Excellent 11.9% |
| Pakistanis | 82.2 /100 | #139 | Excellent 11.9% |
| Immigrants | Peru | 81.1 /100 | #140 | Excellent 11.9% |
| Immigrants | France | 80.5 /100 | #141 | Excellent 11.9% |
| Basques | 80.4 /100 | #142 | Excellent 11.9% |
| Brazilians | 79.7 /100 | #143 | Good 11.9% |
| Icelanders | 77.9 /100 | #144 | Good 11.9% |
| Syrians | 75.1 /100 | #145 | Good 12.0% |
| Afghans | 74.9 /100 | #146 | Good 12.0% |
| Immigrants | Bosnia and Herzegovina | 73.7 /100 | #147 | Good 12.0% |