Marshallese vs Immigrants from Thailand Householder Income Over 65 years
COMPARE
Marshallese
Immigrants from Thailand
Householder Income Over 65 years
Householder Income Over 65 years Comparison
Marshallese
Immigrants from Thailand
$65,874
HOUSEHOLDER INCOME OVER 65 YEARS
99.4/ 100
METRIC RATING
63rd/ 347
METRIC RANK
$60,217
HOUSEHOLDER INCOME OVER 65 YEARS
31.3/ 100
METRIC RATING
187th/ 347
METRIC RANK
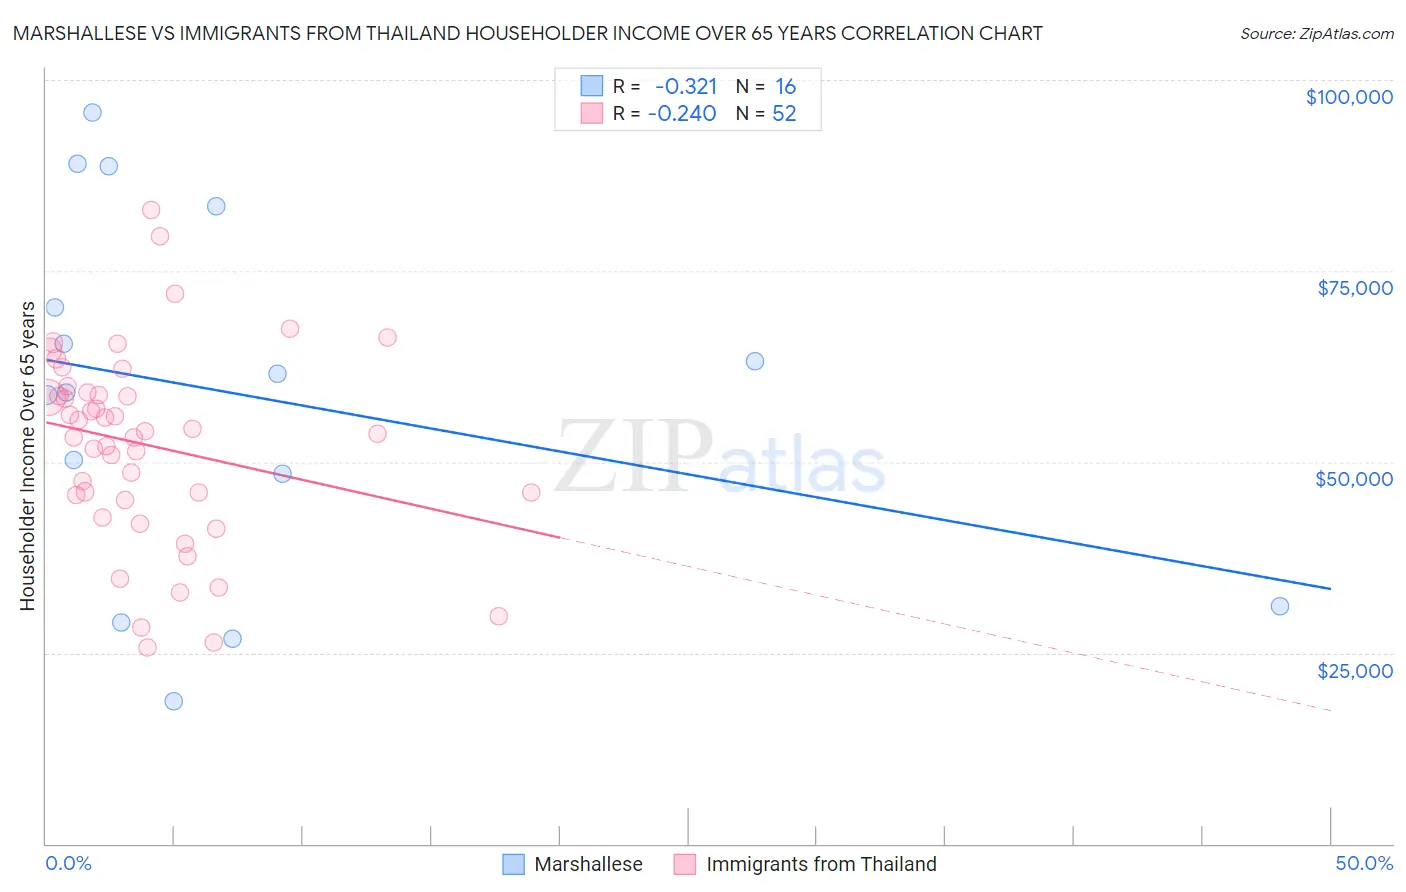
Marshallese vs Immigrants from Thailand Householder Income Over 65 years Correlation Chart
The statistical analysis conducted on geographies consisting of 14,755,394 people shows a mild negative correlation between the proportion of Marshallese and household income with householder over the age of 65 in the United States with a correlation coefficient (R) of -0.321 and weighted average of $65,874. Similarly, the statistical analysis conducted on geographies consisting of 316,391,509 people shows a weak negative correlation between the proportion of Immigrants from Thailand and household income with householder over the age of 65 in the United States with a correlation coefficient (R) of -0.240 and weighted average of $60,217, a difference of 9.4%.
Householder Income Over 65 years Correlation Summary
| Measurement | Marshallese | Immigrants from Thailand |
| Minimum | $18,720 | $25,625 |
| Maximum | $95,763 | $83,060 |
| Range | $77,043 | $57,435 |
| Mean | $58,723 | $52,191 |
| Median | $60,305 | $53,828 |
| Interquartile 25% (IQ1) | $39,754 | $45,336 |
| Interquartile 75% (IQ3) | $76,864 | $58,896 |
| Interquartile Range (IQR) | $37,109 | $13,560 |
| Standard Deviation (Sample) | $23,740 | $12,681 |
| Standard Deviation (Population) | $22,986 | $12,558 |
Similar Demographics by Householder Income Over 65 years
Demographics Similar to Marshallese by Householder Income Over 65 years
In terms of householder income over 65 years, the demographic groups most similar to Marshallese are Zimbabwean ($65,854, a difference of 0.030%), Immigrants from Sierra Leone ($66,009, a difference of 0.21%), Maltese ($66,027, a difference of 0.23%), Immigrants from England ($65,715, a difference of 0.24%), and Immigrants from Lithuania ($66,087, a difference of 0.32%).
| Demographics | Rating | Rank | Householder Income Over 65 years |
| Laotians | 99.6 /100 | #56 | Exceptional $66,306 |
| Bulgarians | 99.6 /100 | #57 | Exceptional $66,236 |
| Immigrants | Philippines | 99.6 /100 | #58 | Exceptional $66,161 |
| Immigrants | Norway | 99.5 /100 | #59 | Exceptional $66,118 |
| Immigrants | Lithuania | 99.5 /100 | #60 | Exceptional $66,087 |
| Maltese | 99.5 /100 | #61 | Exceptional $66,027 |
| Immigrants | Sierra Leone | 99.5 /100 | #62 | Exceptional $66,009 |
| Marshallese | 99.4 /100 | #63 | Exceptional $65,874 |
| Zimbabweans | 99.4 /100 | #64 | Exceptional $65,854 |
| Immigrants | England | 99.3 /100 | #65 | Exceptional $65,715 |
| South Africans | 99.3 /100 | #66 | Exceptional $65,652 |
| Immigrants | Malaysia | 99.1 /100 | #67 | Exceptional $65,497 |
| Egyptians | 99.1 /100 | #68 | Exceptional $65,441 |
| Samoans | 99.1 /100 | #69 | Exceptional $65,427 |
| Mongolians | 99.0 /100 | #70 | Exceptional $65,326 |
Demographics Similar to Immigrants from Thailand by Householder Income Over 65 years
In terms of householder income over 65 years, the demographic groups most similar to Immigrants from Thailand are Slovene ($60,241, a difference of 0.040%), Albanian ($60,249, a difference of 0.050%), Immigrants from Eritrea ($60,096, a difference of 0.20%), Ghanaian ($60,043, a difference of 0.29%), and Iraqi ($60,466, a difference of 0.41%).
| Demographics | Rating | Rank | Householder Income Over 65 years |
| Immigrants | Morocco | 41.7 /100 | #180 | Average $60,647 |
| Celtics | 40.7 /100 | #181 | Average $60,608 |
| Czechoslovakians | 40.0 /100 | #182 | Average $60,581 |
| Kenyans | 38.4 /100 | #183 | Fair $60,514 |
| Iraqis | 37.2 /100 | #184 | Fair $60,466 |
| Albanians | 32.0 /100 | #185 | Fair $60,249 |
| Slovenes | 31.8 /100 | #186 | Fair $60,241 |
| Immigrants | Thailand | 31.3 /100 | #187 | Fair $60,217 |
| Immigrants | Eritrea | 28.6 /100 | #188 | Fair $60,096 |
| Ghanaians | 27.5 /100 | #189 | Fair $60,043 |
| Puget Sound Salish | 25.3 /100 | #190 | Fair $59,934 |
| Belgians | 24.9 /100 | #191 | Fair $59,915 |
| South Americans | 23.8 /100 | #192 | Fair $59,854 |
| Immigrants | Costa Rica | 23.6 /100 | #193 | Fair $59,848 |
| Immigrants | Africa | 23.4 /100 | #194 | Fair $59,837 |