Marshallese vs Immigrants from Thailand Unemployment Among Ages 25 to 29 years
COMPARE
Marshallese
Immigrants from Thailand
Unemployment Among Ages 25 to 29 years
Unemployment Among Ages 25 to 29 years Comparison
Marshallese
Immigrants from Thailand
6.4%
UNEMPLOYMENT AMONG AGES 25 TO 29 YEARS
94.7/ 100
METRIC RATING
87th/ 347
METRIC RANK
6.6%
UNEMPLOYMENT AMONG AGES 25 TO 29 YEARS
68.4/ 100
METRIC RATING
147th/ 347
METRIC RANK
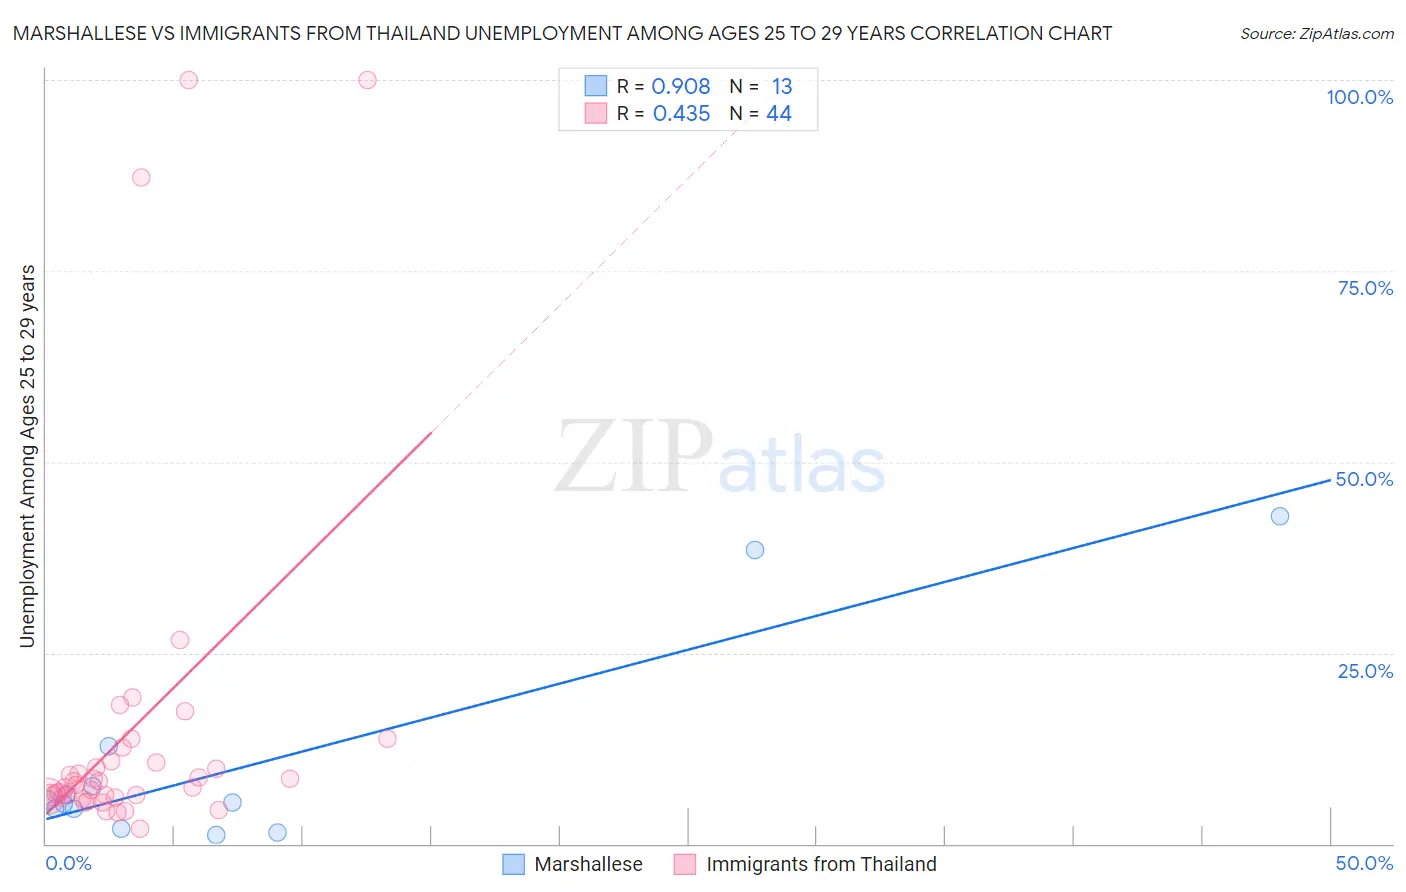
Marshallese vs Immigrants from Thailand Unemployment Among Ages 25 to 29 years Correlation Chart
The statistical analysis conducted on geographies consisting of 14,672,046 people shows a near-perfect positive correlation between the proportion of Marshallese and unemployment rate among population between the ages 25 and 29 in the United States with a correlation coefficient (R) of 0.908 and weighted average of 6.4%. Similarly, the statistical analysis conducted on geographies consisting of 306,848,508 people shows a moderate positive correlation between the proportion of Immigrants from Thailand and unemployment rate among population between the ages 25 and 29 in the United States with a correlation coefficient (R) of 0.435 and weighted average of 6.6%, a difference of 3.4%.
Unemployment Among Ages 25 to 29 years Correlation Summary
| Measurement | Marshallese | Immigrants from Thailand |
| Minimum | 1.2% | 1.9% |
| Maximum | 42.9% | 100.0% |
| Range | 41.7% | 98.1% |
| Mean | 10.6% | 14.6% |
| Median | 5.4% | 7.5% |
| Interquartile 25% (IQ1) | 3.3% | 6.2% |
| Interquartile 75% (IQ3) | 10.1% | 10.7% |
| Interquartile Range (IQR) | 6.8% | 4.5% |
| Standard Deviation (Sample) | 13.7% | 22.7% |
| Standard Deviation (Population) | 13.2% | 22.5% |
Similar Demographics by Unemployment Among Ages 25 to 29 years
Demographics Similar to Marshallese by Unemployment Among Ages 25 to 29 years
In terms of unemployment among ages 25 to 29 years, the demographic groups most similar to Marshallese are Immigrants from Asia (6.3%, a difference of 0.050%), Immigrants from Indonesia (6.4%, a difference of 0.060%), Immigrants from Sweden (6.3%, a difference of 0.15%), Immigrants from Spain (6.3%, a difference of 0.17%), and Immigrants from Oceania (6.4%, a difference of 0.17%).
| Demographics | Rating | Rank | Unemployment Among Ages 25 to 29 years |
| Immigrants | Romania | 95.9 /100 | #80 | Exceptional 6.3% |
| Iranians | 95.8 /100 | #81 | Exceptional 6.3% |
| Immigrants | Poland | 95.7 /100 | #82 | Exceptional 6.3% |
| Slovenes | 95.3 /100 | #83 | Exceptional 6.3% |
| Immigrants | Spain | 95.2 /100 | #84 | Exceptional 6.3% |
| Immigrants | Sweden | 95.1 /100 | #85 | Exceptional 6.3% |
| Immigrants | Asia | 94.9 /100 | #86 | Exceptional 6.3% |
| Marshallese | 94.7 /100 | #87 | Exceptional 6.4% |
| Immigrants | Indonesia | 94.5 /100 | #88 | Exceptional 6.4% |
| Immigrants | Oceania | 94.1 /100 | #89 | Exceptional 6.4% |
| Lebanese | 93.9 /100 | #90 | Exceptional 6.4% |
| Egyptians | 93.9 /100 | #91 | Exceptional 6.4% |
| Immigrants | North Macedonia | 93.6 /100 | #92 | Exceptional 6.4% |
| Australians | 93.6 /100 | #93 | Exceptional 6.4% |
| Zimbabweans | 93.5 /100 | #94 | Exceptional 6.4% |
Demographics Similar to Immigrants from Thailand by Unemployment Among Ages 25 to 29 years
In terms of unemployment among ages 25 to 29 years, the demographic groups most similar to Immigrants from Thailand are Peruvian (6.6%, a difference of 0.020%), Romanian (6.6%, a difference of 0.080%), Malaysian (6.6%, a difference of 0.090%), Finnish (6.6%, a difference of 0.10%), and Nicaraguan (6.6%, a difference of 0.13%).
| Demographics | Rating | Rank | Unemployment Among Ages 25 to 29 years |
| Immigrants | Pakistan | 73.8 /100 | #140 | Good 6.5% |
| Maltese | 72.9 /100 | #141 | Good 6.5% |
| Slavs | 72.5 /100 | #142 | Good 6.5% |
| Lithuanians | 72.2 /100 | #143 | Good 6.5% |
| Immigrants | Micronesia | 71.5 /100 | #144 | Good 6.6% |
| Nicaraguans | 70.2 /100 | #145 | Good 6.6% |
| Romanians | 69.5 /100 | #146 | Good 6.6% |
| Immigrants | Thailand | 68.4 /100 | #147 | Good 6.6% |
| Peruvians | 68.1 /100 | #148 | Good 6.6% |
| Malaysians | 67.1 /100 | #149 | Good 6.6% |
| Finns | 66.9 /100 | #150 | Good 6.6% |
| Ukrainians | 65.5 /100 | #151 | Good 6.6% |
| Samoans | 64.6 /100 | #152 | Good 6.6% |
| Immigrants | Italy | 64.4 /100 | #153 | Good 6.6% |
| Colombians | 64.0 /100 | #154 | Good 6.6% |