Marshallese vs Immigrants from Jordan Female Poverty Among 25-34 Year Olds
COMPARE
Marshallese
Immigrants from Jordan
Female Poverty Among 25-34 Year Olds
Female Poverty Among 25-34 Year Olds Comparison
Marshallese
Immigrants from Jordan
15.3%
FEMALE POVERTY AMONG 25-34 YEAR OLDS
0.2/ 100
METRIC RATING
260th/ 347
METRIC RANK
12.4%
FEMALE POVERTY AMONG 25-34 YEAR OLDS
98.5/ 100
METRIC RATING
79th/ 347
METRIC RANK
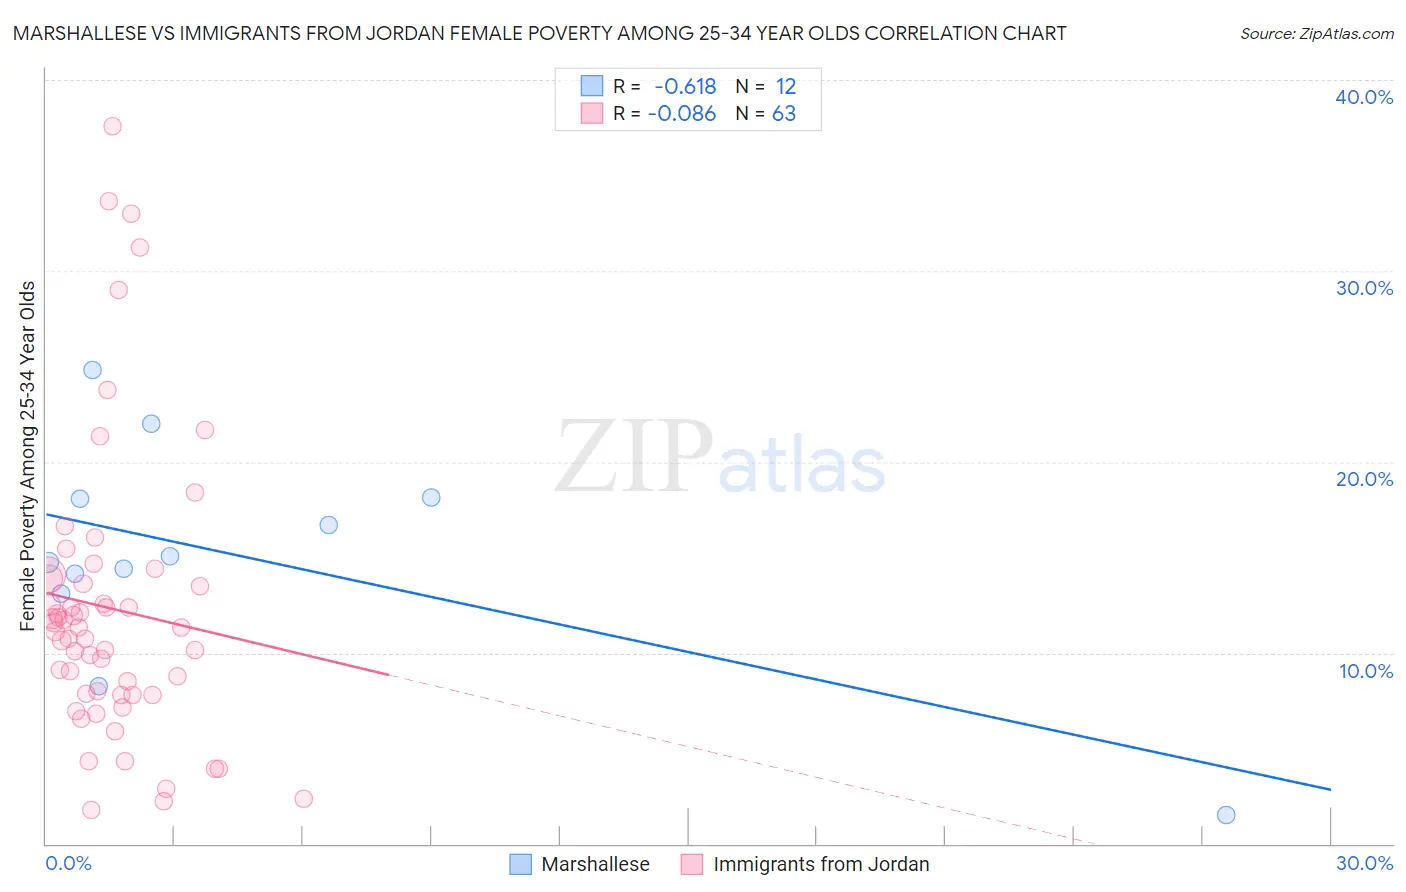
Marshallese vs Immigrants from Jordan Female Poverty Among 25-34 Year Olds Correlation Chart
The statistical analysis conducted on geographies consisting of 14,731,838 people shows a significant negative correlation between the proportion of Marshallese and poverty level among females between the ages 25 and 34 in the United States with a correlation coefficient (R) of -0.618 and weighted average of 15.3%. Similarly, the statistical analysis conducted on geographies consisting of 180,469,872 people shows a slight negative correlation between the proportion of Immigrants from Jordan and poverty level among females between the ages 25 and 34 in the United States with a correlation coefficient (R) of -0.086 and weighted average of 12.4%, a difference of 23.6%.
Female Poverty Among 25-34 Year Olds Correlation Summary
| Measurement | Marshallese | Immigrants from Jordan |
| Minimum | 1.5% | 1.8% |
| Maximum | 24.8% | 37.6% |
| Range | 23.3% | 35.8% |
| Mean | 15.1% | 12.3% |
| Median | 14.9% | 11.3% |
| Interquartile 25% (IQ1) | 13.6% | 7.8% |
| Interquartile 75% (IQ3) | 18.1% | 13.9% |
| Interquartile Range (IQR) | 4.5% | 6.1% |
| Standard Deviation (Sample) | 6.0% | 7.6% |
| Standard Deviation (Population) | 5.8% | 7.5% |
Similar Demographics by Female Poverty Among 25-34 Year Olds
Demographics Similar to Marshallese by Female Poverty Among 25-34 Year Olds
In terms of female poverty among 25-34 year olds, the demographic groups most similar to Marshallese are Liberian (15.3%, a difference of 0.22%), Immigrants from Belize (15.3%, a difference of 0.26%), Immigrants from Cuba (15.2%, a difference of 0.37%), Nepalese (15.2%, a difference of 0.39%), and Mexican American Indian (15.4%, a difference of 0.50%).
| Demographics | Rating | Rank | Female Poverty Among 25-34 Year Olds |
| Immigrants | West Indies | 0.4 /100 | #253 | Tragic 15.1% |
| Somalis | 0.4 /100 | #254 | Tragic 15.1% |
| Immigrants | Laos | 0.3 /100 | #255 | Tragic 15.2% |
| West Indians | 0.3 /100 | #256 | Tragic 15.2% |
| Immigrants | Burma/Myanmar | 0.3 /100 | #257 | Tragic 15.2% |
| Nepalese | 0.2 /100 | #258 | Tragic 15.2% |
| Immigrants | Cuba | 0.2 /100 | #259 | Tragic 15.2% |
| Marshallese | 0.2 /100 | #260 | Tragic 15.3% |
| Liberians | 0.2 /100 | #261 | Tragic 15.3% |
| Immigrants | Belize | 0.2 /100 | #262 | Tragic 15.3% |
| Mexican American Indians | 0.2 /100 | #263 | Tragic 15.4% |
| Pennsylvania Germans | 0.1 /100 | #264 | Tragic 15.4% |
| Immigrants | Liberia | 0.1 /100 | #265 | Tragic 15.4% |
| Immigrants | Somalia | 0.1 /100 | #266 | Tragic 15.4% |
| Central Americans | 0.1 /100 | #267 | Tragic 15.5% |
Demographics Similar to Immigrants from Jordan by Female Poverty Among 25-34 Year Olds
In terms of female poverty among 25-34 year olds, the demographic groups most similar to Immigrants from Jordan are Immigrants from Ukraine (12.3%, a difference of 0.27%), Immigrants from Malaysia (12.4%, a difference of 0.27%), Immigrants from Italy (12.3%, a difference of 0.50%), Immigrants from Kazakhstan (12.4%, a difference of 0.51%), and Ethiopian (12.4%, a difference of 0.59%).
| Demographics | Rating | Rank | Female Poverty Among 25-34 Year Olds |
| Lithuanians | 99.1 /100 | #72 | Exceptional 12.2% |
| Immigrants | Vietnam | 98.9 /100 | #73 | Exceptional 12.3% |
| Immigrants | Sweden | 98.9 /100 | #74 | Exceptional 12.3% |
| Estonians | 98.9 /100 | #75 | Exceptional 12.3% |
| Greeks | 98.9 /100 | #76 | Exceptional 12.3% |
| Immigrants | Italy | 98.8 /100 | #77 | Exceptional 12.3% |
| Immigrants | Ukraine | 98.6 /100 | #78 | Exceptional 12.3% |
| Immigrants | Jordan | 98.5 /100 | #79 | Exceptional 12.4% |
| Immigrants | Malaysia | 98.3 /100 | #80 | Exceptional 12.4% |
| Immigrants | Kazakhstan | 98.1 /100 | #81 | Exceptional 12.4% |
| Ethiopians | 98.0 /100 | #82 | Exceptional 12.4% |
| Albanians | 97.7 /100 | #83 | Exceptional 12.5% |
| Immigrants | Latvia | 97.7 /100 | #84 | Exceptional 12.5% |
| Immigrants | South Eastern Asia | 97.6 /100 | #85 | Exceptional 12.5% |
| Croatians | 97.5 /100 | #86 | Exceptional 12.5% |