Marshallese vs Brazilian Female Poverty Among 25-34 Year Olds
COMPARE
Marshallese
Brazilian
Female Poverty Among 25-34 Year Olds
Female Poverty Among 25-34 Year Olds Comparison
Marshallese
Brazilians
15.3%
FEMALE POVERTY AMONG 25-34 YEAR OLDS
0.2/ 100
METRIC RATING
260th/ 347
METRIC RANK
13.1%
FEMALE POVERTY AMONG 25-34 YEAR OLDS
84.5/ 100
METRIC RATING
138th/ 347
METRIC RANK
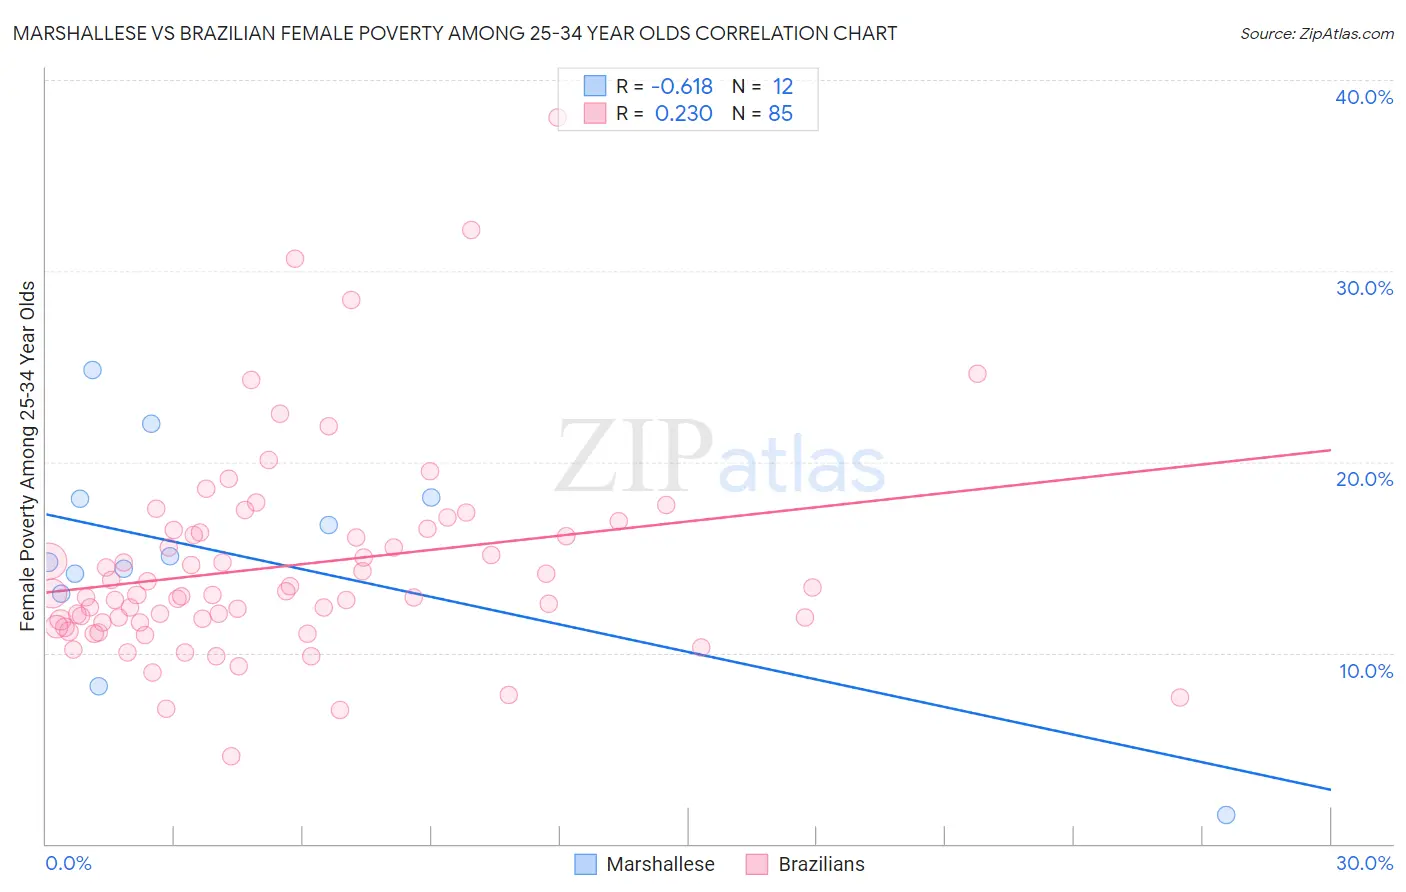
Marshallese vs Brazilian Female Poverty Among 25-34 Year Olds Correlation Chart
The statistical analysis conducted on geographies consisting of 14,731,838 people shows a significant negative correlation between the proportion of Marshallese and poverty level among females between the ages 25 and 34 in the United States with a correlation coefficient (R) of -0.618 and weighted average of 15.3%. Similarly, the statistical analysis conducted on geographies consisting of 319,734,086 people shows a weak positive correlation between the proportion of Brazilians and poverty level among females between the ages 25 and 34 in the United States with a correlation coefficient (R) of 0.230 and weighted average of 13.1%, a difference of 17.0%.
Female Poverty Among 25-34 Year Olds Correlation Summary
| Measurement | Marshallese | Brazilian |
| Minimum | 1.5% | 4.6% |
| Maximum | 24.8% | 38.1% |
| Range | 23.3% | 33.5% |
| Mean | 15.1% | 14.6% |
| Median | 14.9% | 13.0% |
| Interquartile 25% (IQ1) | 13.6% | 11.6% |
| Interquartile 75% (IQ3) | 18.1% | 16.4% |
| Interquartile Range (IQR) | 4.5% | 4.8% |
| Standard Deviation (Sample) | 6.0% | 5.5% |
| Standard Deviation (Population) | 5.8% | 5.4% |
Similar Demographics by Female Poverty Among 25-34 Year Olds
Demographics Similar to Marshallese by Female Poverty Among 25-34 Year Olds
In terms of female poverty among 25-34 year olds, the demographic groups most similar to Marshallese are Liberian (15.3%, a difference of 0.22%), Immigrants from Belize (15.3%, a difference of 0.26%), Immigrants from Cuba (15.2%, a difference of 0.37%), Nepalese (15.2%, a difference of 0.39%), and Mexican American Indian (15.4%, a difference of 0.50%).
| Demographics | Rating | Rank | Female Poverty Among 25-34 Year Olds |
| Immigrants | West Indies | 0.4 /100 | #253 | Tragic 15.1% |
| Somalis | 0.4 /100 | #254 | Tragic 15.1% |
| Immigrants | Laos | 0.3 /100 | #255 | Tragic 15.2% |
| West Indians | 0.3 /100 | #256 | Tragic 15.2% |
| Immigrants | Burma/Myanmar | 0.3 /100 | #257 | Tragic 15.2% |
| Nepalese | 0.2 /100 | #258 | Tragic 15.2% |
| Immigrants | Cuba | 0.2 /100 | #259 | Tragic 15.2% |
| Marshallese | 0.2 /100 | #260 | Tragic 15.3% |
| Liberians | 0.2 /100 | #261 | Tragic 15.3% |
| Immigrants | Belize | 0.2 /100 | #262 | Tragic 15.3% |
| Mexican American Indians | 0.2 /100 | #263 | Tragic 15.4% |
| Pennsylvania Germans | 0.1 /100 | #264 | Tragic 15.4% |
| Immigrants | Liberia | 0.1 /100 | #265 | Tragic 15.4% |
| Immigrants | Somalia | 0.1 /100 | #266 | Tragic 15.4% |
| Central Americans | 0.1 /100 | #267 | Tragic 15.5% |
Demographics Similar to Brazilians by Female Poverty Among 25-34 Year Olds
In terms of female poverty among 25-34 year olds, the demographic groups most similar to Brazilians are Immigrants from Chile (13.1%, a difference of 0.010%), Austrian (13.1%, a difference of 0.13%), Immigrants from Iraq (13.1%, a difference of 0.15%), Immigrants from England (13.0%, a difference of 0.17%), and New Zealander (13.1%, a difference of 0.18%).
| Demographics | Rating | Rank | Female Poverty Among 25-34 Year Olds |
| Pakistanis | 88.4 /100 | #131 | Excellent 13.0% |
| Immigrants | Hungary | 88.3 /100 | #132 | Excellent 13.0% |
| Serbians | 87.6 /100 | #133 | Excellent 13.0% |
| Afghans | 85.8 /100 | #134 | Excellent 13.0% |
| South Africans | 85.7 /100 | #135 | Excellent 13.0% |
| Immigrants | England | 85.5 /100 | #136 | Excellent 13.0% |
| Immigrants | Chile | 84.6 /100 | #137 | Excellent 13.1% |
| Brazilians | 84.5 /100 | #138 | Excellent 13.1% |
| Austrians | 83.7 /100 | #139 | Excellent 13.1% |
| Immigrants | Iraq | 83.6 /100 | #140 | Excellent 13.1% |
| New Zealanders | 83.4 /100 | #141 | Excellent 13.1% |
| Scandinavians | 82.3 /100 | #142 | Excellent 13.1% |
| Israelis | 81.9 /100 | #143 | Excellent 13.1% |
| Native Hawaiians | 78.9 /100 | #144 | Good 13.2% |
| Colombians | 77.2 /100 | #145 | Good 13.2% |