Marshallese vs Ghanaian Child Poverty Under the Age of 16
COMPARE
Marshallese
Ghanaian
Child Poverty Under the Age of 16
Child Poverty Under the Age of 16 Comparison
Marshallese
Ghanaians
18.1%
CHILD POVERTY UNDER THE AGE OF 16
1.8/ 100
METRIC RATING
229th/ 347
METRIC RANK
18.6%
CHILD POVERTY UNDER THE AGE OF 16
0.8/ 100
METRIC RATING
240th/ 347
METRIC RANK
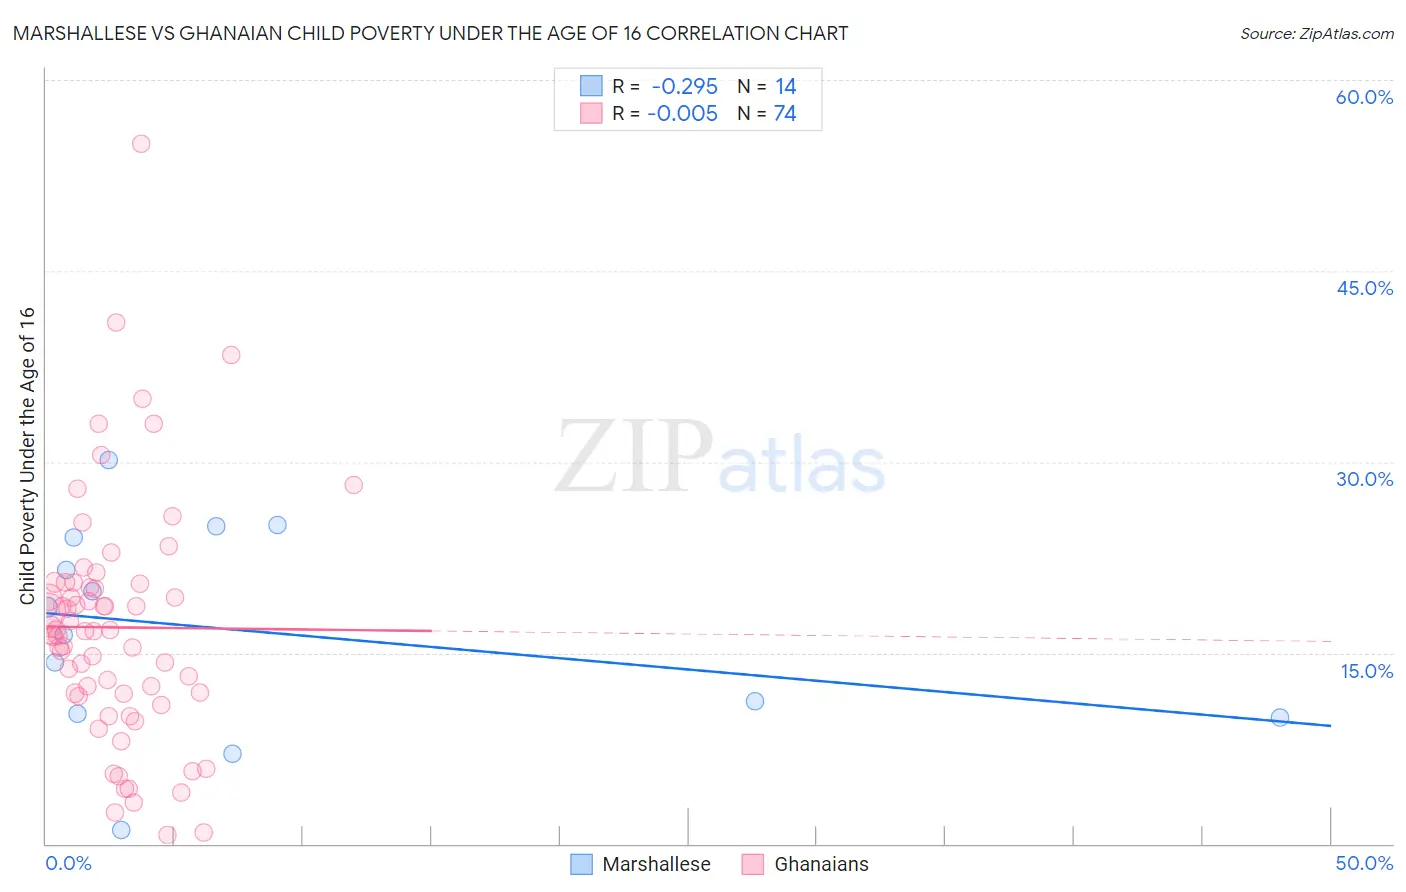
Marshallese vs Ghanaian Child Poverty Under the Age of 16 Correlation Chart
The statistical analysis conducted on geographies consisting of 14,745,855 people shows a weak negative correlation between the proportion of Marshallese and poverty level among children under the age of 16 in the United States with a correlation coefficient (R) of -0.295 and weighted average of 18.1%. Similarly, the statistical analysis conducted on geographies consisting of 189,782,011 people shows no correlation between the proportion of Ghanaians and poverty level among children under the age of 16 in the United States with a correlation coefficient (R) of -0.005 and weighted average of 18.6%, a difference of 2.2%.
Child Poverty Under the Age of 16 Correlation Summary
| Measurement | Marshallese | Ghanaian |
| Minimum | 1.1% | 0.68% |
| Maximum | 30.2% | 54.9% |
| Range | 29.1% | 54.3% |
| Mean | 16.7% | 17.0% |
| Median | 17.5% | 16.7% |
| Interquartile 25% (IQ1) | 10.2% | 11.8% |
| Interquartile 75% (IQ3) | 24.1% | 20.5% |
| Interquartile Range (IQR) | 13.8% | 8.6% |
| Standard Deviation (Sample) | 8.2% | 9.5% |
| Standard Deviation (Population) | 7.9% | 9.4% |
Demographics Similar to Marshallese and Ghanaians by Child Poverty Under the Age of 16
In terms of child poverty under the age of 16, the demographic groups most similar to Marshallese are Nepalese (18.2%, a difference of 0.080%), Nicaraguan (18.2%, a difference of 0.14%), Immigrants from Micronesia (18.0%, a difference of 0.73%), Immigrants from Africa (18.0%, a difference of 0.88%), and American (18.3%, a difference of 1.0%). Similarly, the demographic groups most similar to Ghanaians are Immigrants from Sudan (18.5%, a difference of 0.050%), Immigrants from Eritrea (18.5%, a difference of 0.080%), Sudanese (18.5%, a difference of 0.33%), Cree (18.5%, a difference of 0.36%), and Alsatian (18.6%, a difference of 0.46%).
| Demographics | Rating | Rank | Child Poverty Under the Age of 16 |
| Osage | 3.1 /100 | #224 | Tragic 17.9% |
| Immigrants | Nonimmigrants | 2.7 /100 | #225 | Tragic 17.9% |
| Bermudans | 2.6 /100 | #226 | Tragic 18.0% |
| Immigrants | Africa | 2.5 /100 | #227 | Tragic 18.0% |
| Immigrants | Micronesia | 2.3 /100 | #228 | Tragic 18.0% |
| Marshallese | 1.8 /100 | #229 | Tragic 18.1% |
| Nepalese | 1.7 /100 | #230 | Tragic 18.2% |
| Nicaraguans | 1.7 /100 | #231 | Tragic 18.2% |
| Americans | 1.2 /100 | #232 | Tragic 18.3% |
| Fijians | 1.1 /100 | #233 | Tragic 18.4% |
| Immigrants | Nigeria | 1.0 /100 | #234 | Tragic 18.4% |
| Nigerians | 1.0 /100 | #235 | Tragic 18.4% |
| Cree | 0.9 /100 | #236 | Tragic 18.5% |
| Sudanese | 0.9 /100 | #237 | Tragic 18.5% |
| Immigrants | Eritrea | 0.8 /100 | #238 | Tragic 18.5% |
| Immigrants | Sudan | 0.8 /100 | #239 | Tragic 18.5% |
| Ghanaians | 0.8 /100 | #240 | Tragic 18.6% |
| Alsatians | 0.7 /100 | #241 | Tragic 18.6% |
| Immigrants | Laos | 0.6 /100 | #242 | Tragic 18.7% |
| Immigrants | Cuba | 0.6 /100 | #243 | Tragic 18.7% |
| Cape Verdeans | 0.6 /100 | #244 | Tragic 18.7% |