Marshallese vs Immigrants from England Child Poverty Under the Age of 16
COMPARE
Marshallese
Immigrants from England
Child Poverty Under the Age of 16
Child Poverty Under the Age of 16 Comparison
Marshallese
Immigrants from England
18.1%
CHILD POVERTY UNDER THE AGE OF 16
1.8/ 100
METRIC RATING
229th/ 347
METRIC RANK
14.8%
CHILD POVERTY UNDER THE AGE OF 16
94.8/ 100
METRIC RATING
104th/ 347
METRIC RANK
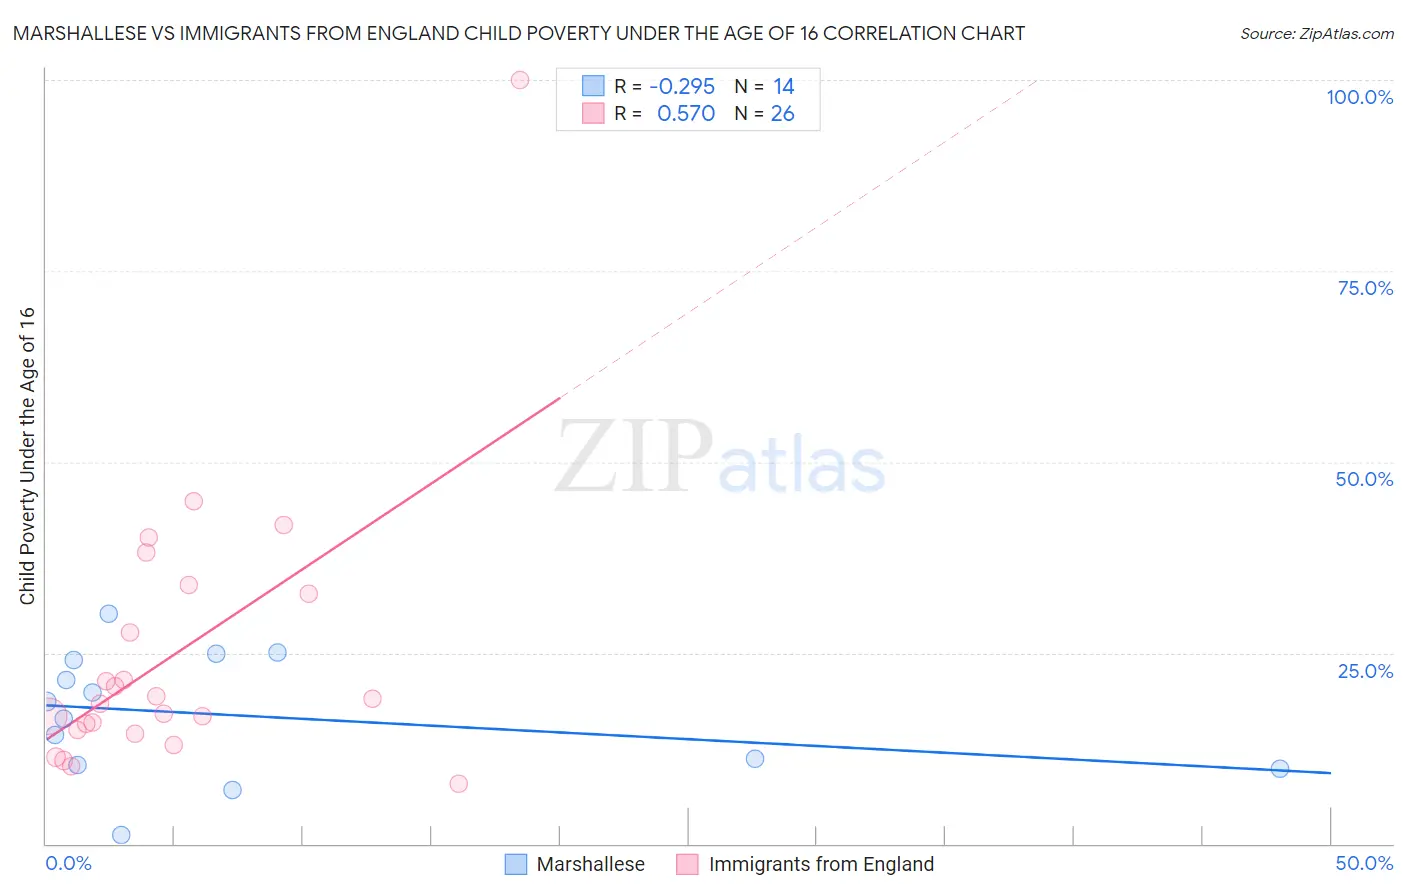
Marshallese vs Immigrants from England Child Poverty Under the Age of 16 Correlation Chart
The statistical analysis conducted on geographies consisting of 14,745,855 people shows a weak negative correlation between the proportion of Marshallese and poverty level among children under the age of 16 in the United States with a correlation coefficient (R) of -0.295 and weighted average of 18.1%. Similarly, the statistical analysis conducted on geographies consisting of 387,672,551 people shows a substantial positive correlation between the proportion of Immigrants from England and poverty level among children under the age of 16 in the United States with a correlation coefficient (R) of 0.570 and weighted average of 14.8%, a difference of 22.7%.
Child Poverty Under the Age of 16 Correlation Summary
| Measurement | Marshallese | Immigrants from England |
| Minimum | 1.1% | 7.8% |
| Maximum | 30.2% | 100.0% |
| Range | 29.1% | 92.2% |
| Mean | 16.7% | 24.7% |
| Median | 17.5% | 18.6% |
| Interquartile 25% (IQ1) | 10.2% | 14.9% |
| Interquartile 75% (IQ3) | 24.1% | 32.7% |
| Interquartile Range (IQR) | 13.8% | 17.8% |
| Standard Deviation (Sample) | 8.2% | 18.6% |
| Standard Deviation (Population) | 7.9% | 18.2% |
Similar Demographics by Child Poverty Under the Age of 16
Demographics Similar to Marshallese by Child Poverty Under the Age of 16
In terms of child poverty under the age of 16, the demographic groups most similar to Marshallese are Nepalese (18.2%, a difference of 0.080%), Nicaraguan (18.2%, a difference of 0.14%), Immigrants from Micronesia (18.0%, a difference of 0.73%), Immigrants from Africa (18.0%, a difference of 0.88%), and American (18.3%, a difference of 1.0%).
| Demographics | Rating | Rank | Child Poverty Under the Age of 16 |
| Immigrants | Armenia | 3.6 /100 | #222 | Tragic 17.8% |
| Immigrants | Cambodia | 3.3 /100 | #223 | Tragic 17.8% |
| Osage | 3.1 /100 | #224 | Tragic 17.9% |
| Immigrants | Nonimmigrants | 2.7 /100 | #225 | Tragic 17.9% |
| Bermudans | 2.6 /100 | #226 | Tragic 18.0% |
| Immigrants | Africa | 2.5 /100 | #227 | Tragic 18.0% |
| Immigrants | Micronesia | 2.3 /100 | #228 | Tragic 18.0% |
| Marshallese | 1.8 /100 | #229 | Tragic 18.1% |
| Nepalese | 1.7 /100 | #230 | Tragic 18.2% |
| Nicaraguans | 1.7 /100 | #231 | Tragic 18.2% |
| Americans | 1.2 /100 | #232 | Tragic 18.3% |
| Fijians | 1.1 /100 | #233 | Tragic 18.4% |
| Immigrants | Nigeria | 1.0 /100 | #234 | Tragic 18.4% |
| Nigerians | 1.0 /100 | #235 | Tragic 18.4% |
| Cree | 0.9 /100 | #236 | Tragic 18.5% |
Demographics Similar to Immigrants from England by Child Poverty Under the Age of 16
In terms of child poverty under the age of 16, the demographic groups most similar to Immigrants from England are Immigrants from Egypt (14.8%, a difference of 0.040%), Romanian (14.8%, a difference of 0.090%), Basque (14.8%, a difference of 0.11%), Immigrants from Switzerland (14.8%, a difference of 0.16%), and Dutch (14.8%, a difference of 0.17%).
| Demographics | Rating | Rank | Child Poverty Under the Age of 16 |
| Paraguayans | 95.7 /100 | #97 | Exceptional 14.7% |
| Immigrants | Belarus | 95.7 /100 | #98 | Exceptional 14.7% |
| British | 95.5 /100 | #99 | Exceptional 14.7% |
| Dutch | 95.1 /100 | #100 | Exceptional 14.8% |
| Immigrants | Switzerland | 95.1 /100 | #101 | Exceptional 14.8% |
| Romanians | 95.0 /100 | #102 | Exceptional 14.8% |
| Immigrants | Egypt | 94.9 /100 | #103 | Exceptional 14.8% |
| Immigrants | England | 94.8 /100 | #104 | Exceptional 14.8% |
| Basques | 94.7 /100 | #105 | Exceptional 14.8% |
| Serbians | 94.5 /100 | #106 | Exceptional 14.8% |
| Chileans | 94.4 /100 | #107 | Exceptional 14.8% |
| Jordanians | 94.2 /100 | #108 | Exceptional 14.8% |
| Tlingit-Haida | 94.1 /100 | #109 | Exceptional 14.9% |
| English | 93.5 /100 | #110 | Exceptional 14.9% |
| Immigrants | Denmark | 93.5 /100 | #111 | Exceptional 14.9% |