Maltese vs Yuman Single Male Poverty
COMPARE
Maltese
Yuman
Single Male Poverty
Single Male Poverty Comparison
Maltese
Yuman
11.3%
SINGLE MALE POVERTY
100.0/ 100
METRIC RATING
25th/ 347
METRIC RANK
21.3%
SINGLE MALE POVERTY
0.0/ 100
METRIC RATING
335th/ 347
METRIC RANK
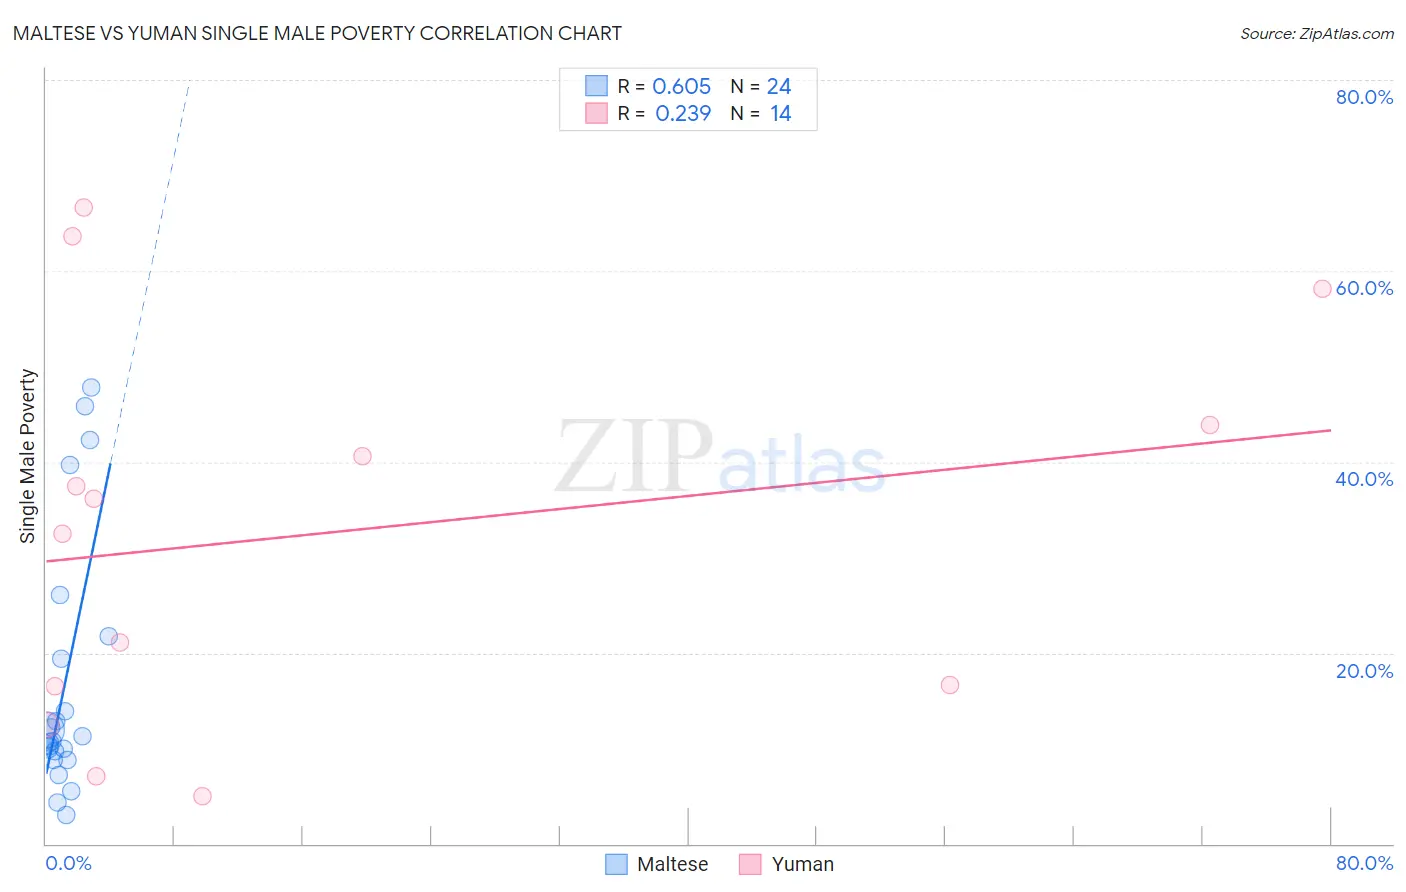
Maltese vs Yuman Single Male Poverty Correlation Chart
The statistical analysis conducted on geographies consisting of 117,992,298 people shows a significant positive correlation between the proportion of Maltese and poverty level among single males in the United States with a correlation coefficient (R) of 0.605 and weighted average of 11.3%. Similarly, the statistical analysis conducted on geographies consisting of 40,221,035 people shows a weak positive correlation between the proportion of Yuman and poverty level among single males in the United States with a correlation coefficient (R) of 0.239 and weighted average of 21.3%, a difference of 89.2%.
Single Male Poverty Correlation Summary
| Measurement | Maltese | Yuman |
| Minimum | 3.0% | 5.0% |
| Maximum | 47.8% | 66.7% |
| Range | 44.8% | 61.7% |
| Mean | 16.8% | 32.7% |
| Median | 10.9% | 34.3% |
| Interquartile 25% (IQ1) | 9.2% | 16.6% |
| Interquartile 75% (IQ3) | 20.5% | 43.9% |
| Interquartile Range (IQR) | 11.3% | 27.3% |
| Standard Deviation (Sample) | 13.4% | 20.5% |
| Standard Deviation (Population) | 13.1% | 19.8% |
Similar Demographics by Single Male Poverty
Demographics Similar to Maltese by Single Male Poverty
In terms of single male poverty, the demographic groups most similar to Maltese are Indian (Asian) (11.3%, a difference of 0.020%), Bolivian (11.2%, a difference of 0.22%), Immigrants from Japan (11.3%, a difference of 0.33%), Immigrants from Pakistan (11.2%, a difference of 0.43%), and Asian (11.2%, a difference of 0.52%).
| Demographics | Rating | Rank | Single Male Poverty |
| Immigrants | Bolivia | 100.0 /100 | #18 | Exceptional 11.1% |
| Immigrants | Moldova | 100.0 /100 | #19 | Exceptional 11.2% |
| Ethiopians | 100.0 /100 | #20 | Exceptional 11.2% |
| Asians | 100.0 /100 | #21 | Exceptional 11.2% |
| Immigrants | Pakistan | 100.0 /100 | #22 | Exceptional 11.2% |
| Bolivians | 100.0 /100 | #23 | Exceptional 11.2% |
| Indians (Asian) | 100.0 /100 | #24 | Exceptional 11.3% |
| Maltese | 100.0 /100 | #25 | Exceptional 11.3% |
| Immigrants | Japan | 100.0 /100 | #26 | Exceptional 11.3% |
| Immigrants | China | 100.0 /100 | #27 | Exceptional 11.4% |
| Immigrants | Asia | 100.0 /100 | #28 | Exceptional 11.4% |
| Immigrants | Egypt | 100.0 /100 | #29 | Exceptional 11.4% |
| Iranians | 100.0 /100 | #30 | Exceptional 11.4% |
| Immigrants | Iran | 100.0 /100 | #31 | Exceptional 11.4% |
| Immigrants | Eastern Asia | 100.0 /100 | #32 | Exceptional 11.4% |
Demographics Similar to Yuman by Single Male Poverty
In terms of single male poverty, the demographic groups most similar to Yuman are Tohono O'odham (21.6%, a difference of 1.2%), Apache (21.6%, a difference of 1.3%), Pueblo (21.6%, a difference of 1.5%), Arapaho (21.9%, a difference of 3.0%), and Sioux (22.2%, a difference of 4.3%).
| Demographics | Rating | Rank | Single Male Poverty |
| Kiowa | 0.0 /100 | #328 | Tragic 18.3% |
| Colville | 0.0 /100 | #329 | Tragic 18.4% |
| Cajuns | 0.0 /100 | #330 | Tragic 19.1% |
| Paiute | 0.0 /100 | #331 | Tragic 19.3% |
| Natives/Alaskans | 0.0 /100 | #332 | Tragic 19.6% |
| Inupiat | 0.0 /100 | #333 | Tragic 20.0% |
| Pima | 0.0 /100 | #334 | Tragic 20.2% |
| Yuman | 0.0 /100 | #335 | Tragic 21.3% |
| Tohono O'odham | 0.0 /100 | #336 | Tragic 21.6% |
| Apache | 0.0 /100 | #337 | Tragic 21.6% |
| Pueblo | 0.0 /100 | #338 | Tragic 21.6% |
| Arapaho | 0.0 /100 | #339 | Tragic 21.9% |
| Sioux | 0.0 /100 | #340 | Tragic 22.2% |
| Crow | 0.0 /100 | #341 | Tragic 23.3% |
| Houma | 0.0 /100 | #342 | Tragic 23.5% |