Maltese vs Yaqui Poverty
COMPARE
Maltese
Yaqui
Poverty
Poverty Comparison
Maltese
Yaqui
10.2%
POVERTY
99.9/ 100
METRIC RATING
8th/ 347
METRIC RANK
15.1%
POVERTY
0.0/ 100
METRIC RATING
288th/ 347
METRIC RANK
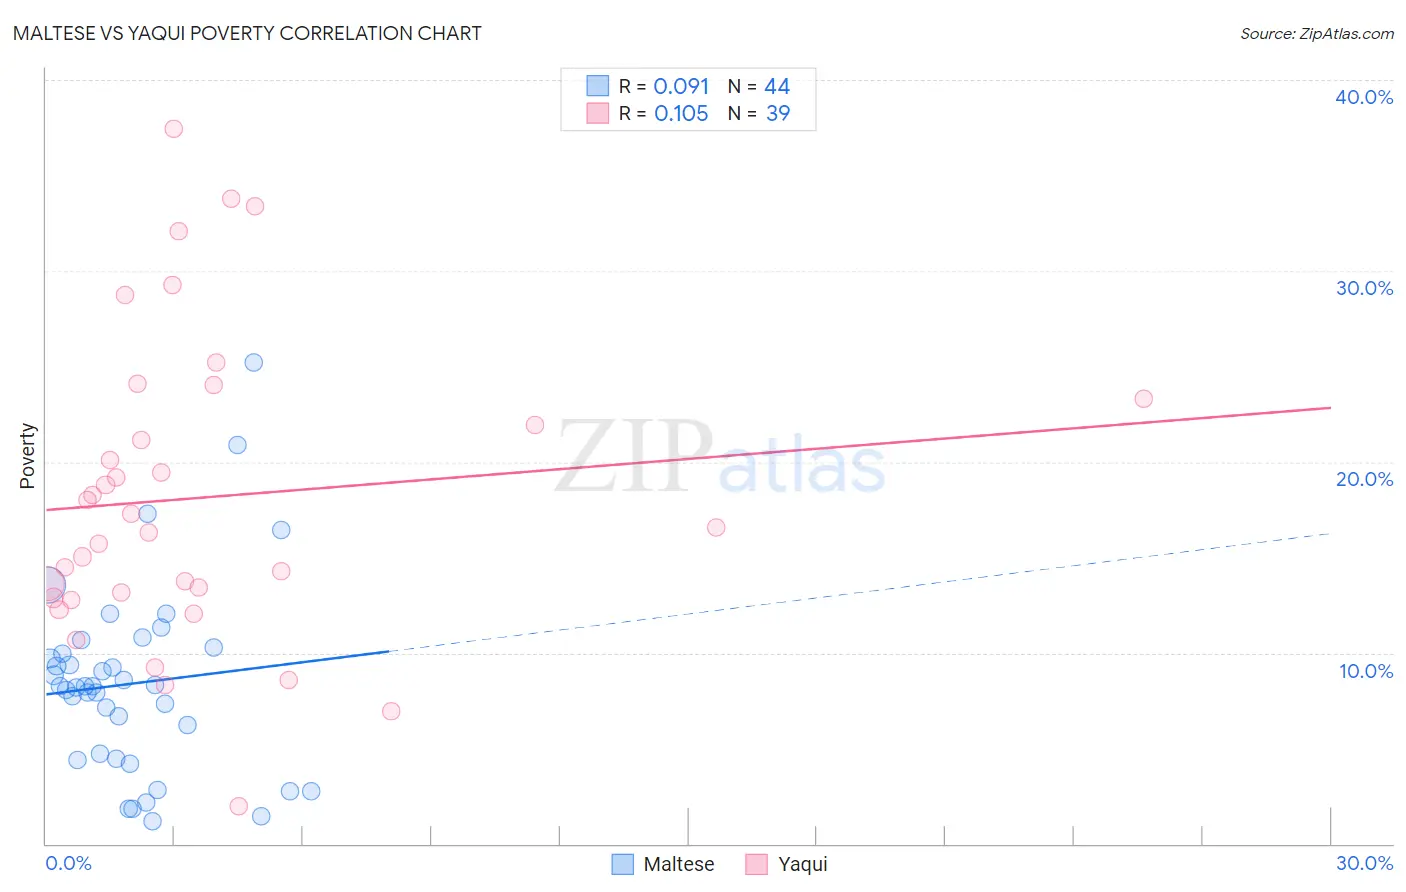
Maltese vs Yaqui Poverty Correlation Chart
The statistical analysis conducted on geographies consisting of 126,440,716 people shows a slight positive correlation between the proportion of Maltese and poverty level in the United States with a correlation coefficient (R) of 0.091 and weighted average of 10.2%. Similarly, the statistical analysis conducted on geographies consisting of 107,716,749 people shows a poor positive correlation between the proportion of Yaqui and poverty level in the United States with a correlation coefficient (R) of 0.105 and weighted average of 15.1%, a difference of 48.3%.
Poverty Correlation Summary
| Measurement | Maltese | Yaqui |
| Minimum | 1.2% | 2.0% |
| Maximum | 25.2% | 37.5% |
| Range | 24.1% | 35.5% |
| Mean | 8.4% | 18.1% |
| Median | 8.2% | 16.6% |
| Interquartile 25% (IQ1) | 4.6% | 12.9% |
| Interquartile 75% (IQ3) | 10.1% | 23.3% |
| Interquartile Range (IQR) | 5.5% | 10.4% |
| Standard Deviation (Sample) | 5.0% | 8.0% |
| Standard Deviation (Population) | 4.9% | 7.9% |
Similar Demographics by Poverty
Demographics Similar to Maltese by Poverty
In terms of poverty, the demographic groups most similar to Maltese are Filipino (10.1%, a difference of 0.42%), Immigrants from South Central Asia (10.2%, a difference of 0.45%), Assyrian/Chaldean/Syriac (10.1%, a difference of 0.56%), Immigrants from Ireland (10.1%, a difference of 0.74%), and Bulgarian (10.2%, a difference of 0.86%).
| Demographics | Rating | Rank | Poverty |
| Immigrants | India | 100.0 /100 | #1 | Exceptional 9.0% |
| Chinese | 100.0 /100 | #2 | Exceptional 9.5% |
| Thais | 100.0 /100 | #3 | Exceptional 9.6% |
| Immigrants | Taiwan | 100.0 /100 | #4 | Exceptional 9.7% |
| Immigrants | Ireland | 99.9 /100 | #5 | Exceptional 10.1% |
| Assyrians/Chaldeans/Syriacs | 99.9 /100 | #6 | Exceptional 10.1% |
| Filipinos | 99.9 /100 | #7 | Exceptional 10.1% |
| Maltese | 99.9 /100 | #8 | Exceptional 10.2% |
| Immigrants | South Central Asia | 99.9 /100 | #9 | Exceptional 10.2% |
| Bulgarians | 99.9 /100 | #10 | Exceptional 10.2% |
| Immigrants | Lithuania | 99.9 /100 | #11 | Exceptional 10.3% |
| Bhutanese | 99.8 /100 | #12 | Exceptional 10.4% |
| Immigrants | Hong Kong | 99.8 /100 | #13 | Exceptional 10.4% |
| Immigrants | Bolivia | 99.8 /100 | #14 | Exceptional 10.4% |
| Bolivians | 99.8 /100 | #15 | Exceptional 10.4% |
Demographics Similar to Yaqui by Poverty
In terms of poverty, the demographic groups most similar to Yaqui are Inupiat (15.1%, a difference of 0.010%), Immigrants from Belize (15.1%, a difference of 0.12%), Immigrants from Latin America (15.0%, a difference of 0.22%), Mexican (15.1%, a difference of 0.22%), and Immigrants from Cabo Verde (15.1%, a difference of 0.35%).
| Demographics | Rating | Rank | Poverty |
| Immigrants | Barbados | 0.0 /100 | #281 | Tragic 14.9% |
| Comanche | 0.0 /100 | #282 | Tragic 15.0% |
| Immigrants | Haiti | 0.0 /100 | #283 | Tragic 15.0% |
| West Indians | 0.0 /100 | #284 | Tragic 15.0% |
| Vietnamese | 0.0 /100 | #285 | Tragic 15.0% |
| Immigrants | Latin America | 0.0 /100 | #286 | Tragic 15.0% |
| Inupiat | 0.0 /100 | #287 | Tragic 15.1% |
| Yaqui | 0.0 /100 | #288 | Tragic 15.1% |
| Immigrants | Belize | 0.0 /100 | #289 | Tragic 15.1% |
| Mexicans | 0.0 /100 | #290 | Tragic 15.1% |
| Immigrants | Cabo Verde | 0.0 /100 | #291 | Tragic 15.1% |
| Indonesians | 0.0 /100 | #292 | Tragic 15.1% |
| Immigrants | Zaire | 0.0 /100 | #293 | Tragic 15.1% |
| Blackfeet | 0.0 /100 | #294 | Tragic 15.2% |
| Guatemalans | 0.0 /100 | #295 | Tragic 15.3% |