Immigrants from Central America vs Yaqui Receiving Food Stamps
COMPARE
Immigrants from Central America
Yaqui
Receiving Food Stamps
Receiving Food Stamps Comparison
Immigrants from Central America
Yaqui
15.0%
RECEIVING FOOD STAMPS
0.0/ 100
METRIC RATING
282nd/ 347
METRIC RANK
13.9%
RECEIVING FOOD STAMPS
0.5/ 100
METRIC RATING
251st/ 347
METRIC RANK
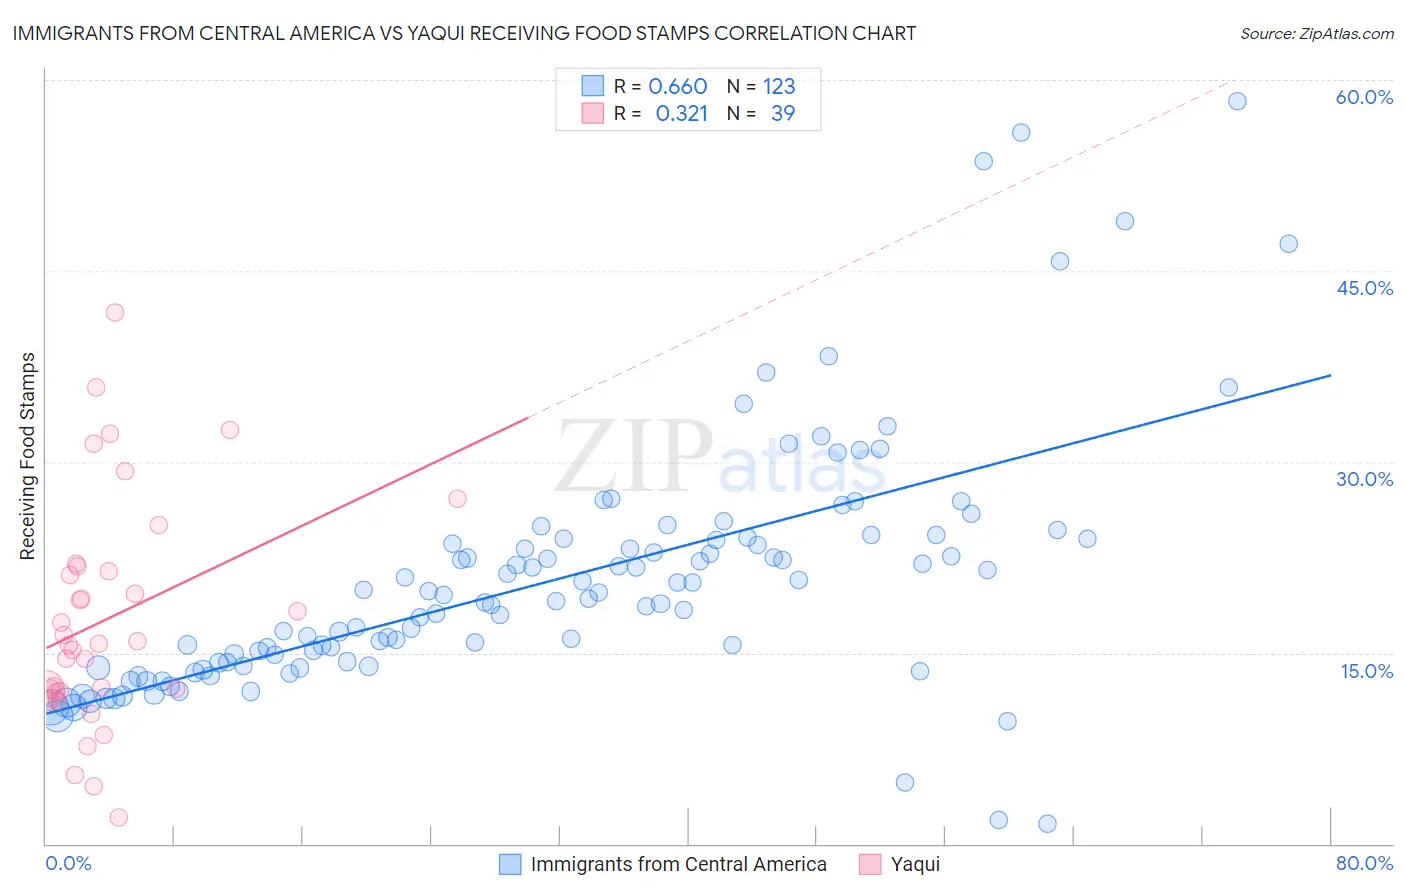
Immigrants from Central America vs Yaqui Receiving Food Stamps Correlation Chart
The statistical analysis conducted on geographies consisting of 534,248,687 people shows a significant positive correlation between the proportion of Immigrants from Central America and percentage of population receiving government assistance and/or food stamps in the United States with a correlation coefficient (R) of 0.660 and weighted average of 15.0%. Similarly, the statistical analysis conducted on geographies consisting of 107,632,766 people shows a mild positive correlation between the proportion of Yaqui and percentage of population receiving government assistance and/or food stamps in the United States with a correlation coefficient (R) of 0.321 and weighted average of 13.9%, a difference of 8.0%.
Receiving Food Stamps Correlation Summary
| Measurement | Immigrants from Central America | Yaqui |
| Minimum | 1.6% | 2.1% |
| Maximum | 58.3% | 41.8% |
| Range | 56.7% | 39.7% |
| Mean | 20.7% | 17.7% |
| Median | 19.3% | 15.7% |
| Interquartile 25% (IQ1) | 14.2% | 12.0% |
| Interquartile 75% (IQ3) | 24.0% | 21.8% |
| Interquartile Range (IQR) | 9.7% | 9.8% |
| Standard Deviation (Sample) | 9.7% | 8.9% |
| Standard Deviation (Population) | 9.7% | 8.8% |
Similar Demographics by Receiving Food Stamps
Demographics Similar to Immigrants from Central America by Receiving Food Stamps
In terms of receiving food stamps, the demographic groups most similar to Immigrants from Central America are Bangladeshi (15.0%, a difference of 0.28%), Immigrants from Ecuador (15.0%, a difference of 0.29%), Spanish American Indian (14.9%, a difference of 0.52%), Immigrants from Liberia (15.1%, a difference of 0.67%), and African (15.1%, a difference of 0.81%).
| Demographics | Rating | Rank | Receiving Food Stamps |
| Ute | 0.1 /100 | #275 | Tragic 14.7% |
| Liberians | 0.1 /100 | #276 | Tragic 14.8% |
| Seminole | 0.1 /100 | #277 | Tragic 14.8% |
| Belizeans | 0.1 /100 | #278 | Tragic 14.8% |
| Kiowa | 0.0 /100 | #279 | Tragic 14.9% |
| Ecuadorians | 0.0 /100 | #280 | Tragic 14.9% |
| Spanish American Indians | 0.0 /100 | #281 | Tragic 14.9% |
| Immigrants | Central America | 0.0 /100 | #282 | Tragic 15.0% |
| Bangladeshis | 0.0 /100 | #283 | Tragic 15.0% |
| Immigrants | Ecuador | 0.0 /100 | #284 | Tragic 15.0% |
| Immigrants | Liberia | 0.0 /100 | #285 | Tragic 15.1% |
| Africans | 0.0 /100 | #286 | Tragic 15.1% |
| Immigrants | Mexico | 0.0 /100 | #287 | Tragic 15.2% |
| Immigrants | Belize | 0.0 /100 | #288 | Tragic 15.2% |
| Immigrants | Senegal | 0.0 /100 | #289 | Tragic 15.3% |
Demographics Similar to Yaqui by Receiving Food Stamps
In terms of receiving food stamps, the demographic groups most similar to Yaqui are Immigrants from Cambodia (13.9%, a difference of 0.070%), Indonesian (13.9%, a difference of 0.24%), Ghanaian (14.0%, a difference of 0.44%), Spanish American (14.0%, a difference of 0.82%), and Immigrants from Laos (13.8%, a difference of 0.88%).
| Demographics | Rating | Rank | Receiving Food Stamps |
| Cajuns | 0.9 /100 | #244 | Tragic 13.7% |
| Immigrants | Somalia | 0.9 /100 | #245 | Tragic 13.7% |
| Cree | 0.8 /100 | #246 | Tragic 13.7% |
| Mexican American Indians | 0.7 /100 | #247 | Tragic 13.8% |
| Immigrants | Laos | 0.7 /100 | #248 | Tragic 13.8% |
| Indonesians | 0.6 /100 | #249 | Tragic 13.9% |
| Immigrants | Cambodia | 0.5 /100 | #250 | Tragic 13.9% |
| Yaqui | 0.5 /100 | #251 | Tragic 13.9% |
| Ghanaians | 0.5 /100 | #252 | Tragic 14.0% |
| Spanish Americans | 0.4 /100 | #253 | Tragic 14.0% |
| Marshallese | 0.3 /100 | #254 | Tragic 14.1% |
| Sub-Saharan Africans | 0.3 /100 | #255 | Tragic 14.1% |
| Japanese | 0.3 /100 | #256 | Tragic 14.1% |
| Arapaho | 0.3 /100 | #257 | Tragic 14.1% |
| Immigrants | Ghana | 0.3 /100 | #258 | Tragic 14.1% |