Macedonian vs Thai Child Poverty Among Girls Under 16
COMPARE
Macedonian
Thai
Child Poverty Among Girls Under 16
Child Poverty Among Girls Under 16 Comparison
Macedonians
Thais
14.7%
CHILD POVERTY AMONG GIRLS UNDER 16
97.6/ 100
METRIC RATING
82nd/ 347
METRIC RANK
11.8%
CHILD POVERTY AMONG GIRLS UNDER 16
100.0/ 100
METRIC RATING
5th/ 347
METRIC RANK
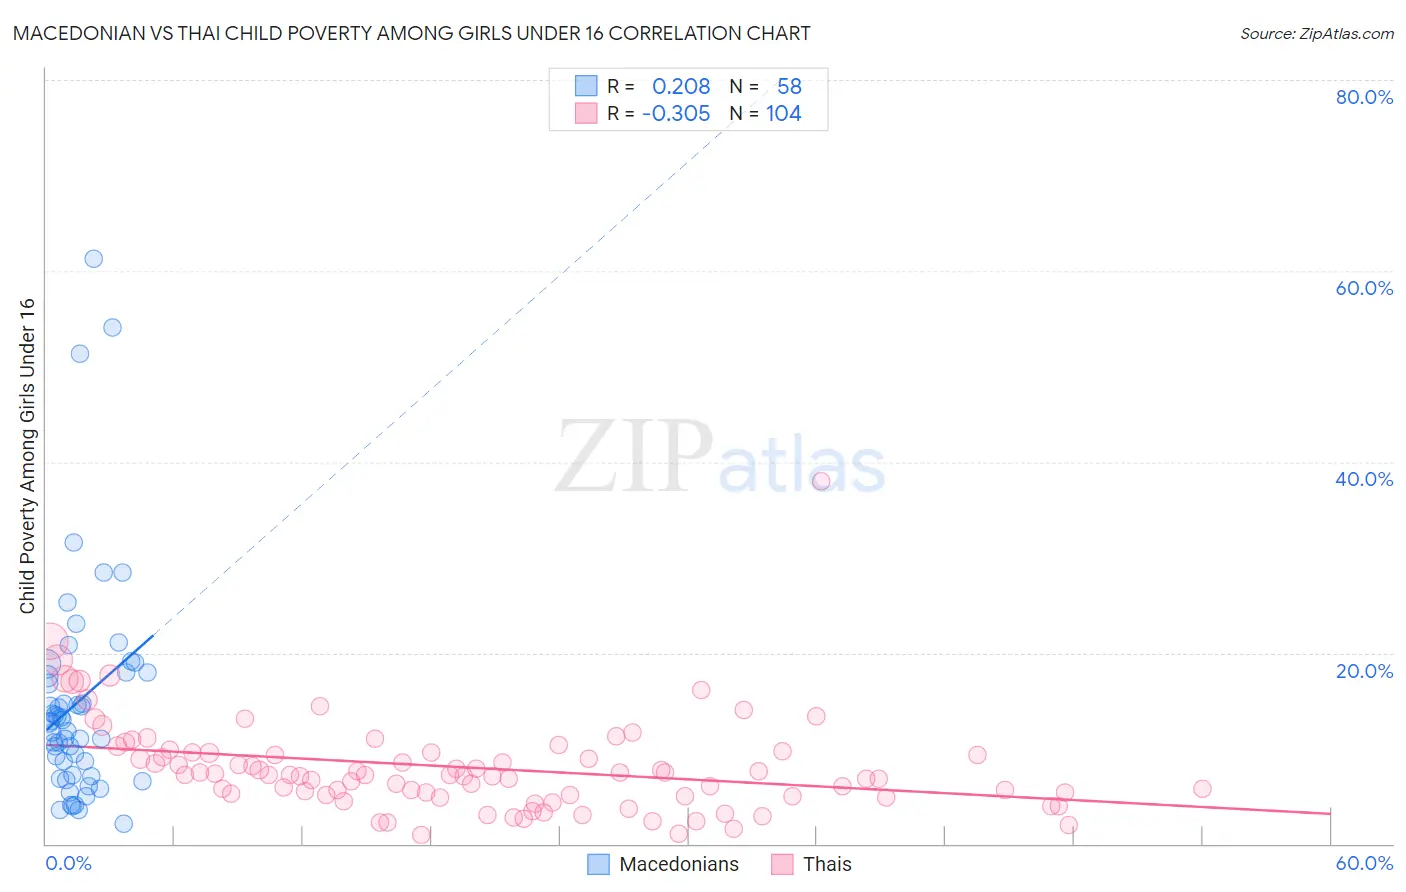
Macedonian vs Thai Child Poverty Among Girls Under 16 Correlation Chart
The statistical analysis conducted on geographies consisting of 131,236,838 people shows a weak positive correlation between the proportion of Macedonians and poverty level among girls under the age of 16 in the United States with a correlation coefficient (R) of 0.208 and weighted average of 14.7%. Similarly, the statistical analysis conducted on geographies consisting of 464,276,547 people shows a mild negative correlation between the proportion of Thais and poverty level among girls under the age of 16 in the United States with a correlation coefficient (R) of -0.305 and weighted average of 11.8%, a difference of 24.5%.
Child Poverty Among Girls Under 16 Correlation Summary
| Measurement | Macedonian | Thai |
| Minimum | 2.1% | 0.97% |
| Maximum | 61.2% | 38.0% |
| Range | 59.1% | 37.1% |
| Mean | 14.9% | 8.0% |
| Median | 12.8% | 7.2% |
| Interquartile 25% (IQ1) | 7.2% | 5.0% |
| Interquartile 75% (IQ3) | 17.9% | 9.6% |
| Interquartile Range (IQR) | 10.7% | 4.6% |
| Standard Deviation (Sample) | 11.7% | 5.1% |
| Standard Deviation (Population) | 11.6% | 5.1% |
Similar Demographics by Child Poverty Among Girls Under 16
Demographics Similar to Macedonians by Child Poverty Among Girls Under 16
In terms of child poverty among girls under 16, the demographic groups most similar to Macedonians are Ukrainian (14.7%, a difference of 0.24%), Immigrants from Italy (14.8%, a difference of 0.25%), Soviet Union (14.8%, a difference of 0.33%), Egyptian (14.7%, a difference of 0.43%), and Immigrants from Turkey (14.7%, a difference of 0.44%).
| Demographics | Rating | Rank | Child Poverty Among Girls Under 16 |
| Immigrants | Eastern Europe | 98.0 /100 | #75 | Exceptional 14.6% |
| Immigrants | Russia | 97.9 /100 | #76 | Exceptional 14.7% |
| Tlingit-Haida | 97.9 /100 | #77 | Exceptional 14.7% |
| Argentineans | 97.9 /100 | #78 | Exceptional 14.7% |
| Immigrants | Turkey | 97.9 /100 | #79 | Exceptional 14.7% |
| Egyptians | 97.9 /100 | #80 | Exceptional 14.7% |
| Ukrainians | 97.7 /100 | #81 | Exceptional 14.7% |
| Macedonians | 97.6 /100 | #82 | Exceptional 14.7% |
| Immigrants | Italy | 97.4 /100 | #83 | Exceptional 14.8% |
| Soviet Union | 97.3 /100 | #84 | Exceptional 14.8% |
| Swiss | 97.2 /100 | #85 | Exceptional 14.8% |
| Australians | 97.2 /100 | #86 | Exceptional 14.8% |
| Finns | 97.2 /100 | #87 | Exceptional 14.8% |
| Immigrants | Canada | 97.1 /100 | #88 | Exceptional 14.8% |
| Jordanians | 97.1 /100 | #89 | Exceptional 14.8% |
Demographics Similar to Thais by Child Poverty Among Girls Under 16
In terms of child poverty among girls under 16, the demographic groups most similar to Thais are Tsimshian (11.5%, a difference of 3.0%), Filipino (11.4%, a difference of 3.6%), Immigrants from Hong Kong (12.3%, a difference of 4.3%), Chinese (12.3%, a difference of 4.4%), and Immigrants from Taiwan (11.3%, a difference of 4.5%).
| Demographics | Rating | Rank | Child Poverty Among Girls Under 16 |
| Immigrants | India | 100.0 /100 | #1 | Exceptional 11.0% |
| Immigrants | Taiwan | 100.0 /100 | #2 | Exceptional 11.3% |
| Filipinos | 100.0 /100 | #3 | Exceptional 11.4% |
| Tsimshian | 100.0 /100 | #4 | Exceptional 11.5% |
| Thais | 100.0 /100 | #5 | Exceptional 11.8% |
| Immigrants | Hong Kong | 100.0 /100 | #6 | Exceptional 12.3% |
| Chinese | 100.0 /100 | #7 | Exceptional 12.3% |
| Iranians | 100.0 /100 | #8 | Exceptional 12.4% |
| Immigrants | Singapore | 100.0 /100 | #9 | Exceptional 12.5% |
| Immigrants | Iran | 100.0 /100 | #10 | Exceptional 12.6% |
| Immigrants | South Central Asia | 100.0 /100 | #11 | Exceptional 12.7% |
| Bhutanese | 100.0 /100 | #12 | Exceptional 12.7% |
| Immigrants | Ireland | 99.9 /100 | #13 | Exceptional 12.9% |
| Burmese | 99.9 /100 | #14 | Exceptional 13.0% |
| Okinawans | 99.9 /100 | #15 | Exceptional 13.0% |