Carpatho Rusyn vs Cape Verdean Single Mother Poverty
COMPARE
Carpatho Rusyn
Cape Verdean
Single Mother Poverty
Single Mother Poverty Comparison
Carpatho Rusyns
Cape Verdeans
29.1%
SINGLE MOTHER POVERTY
53.8/ 100
METRIC RATING
172nd/ 347
METRIC RANK
30.8%
SINGLE MOTHER POVERTY
0.8/ 100
METRIC RATING
249th/ 347
METRIC RANK
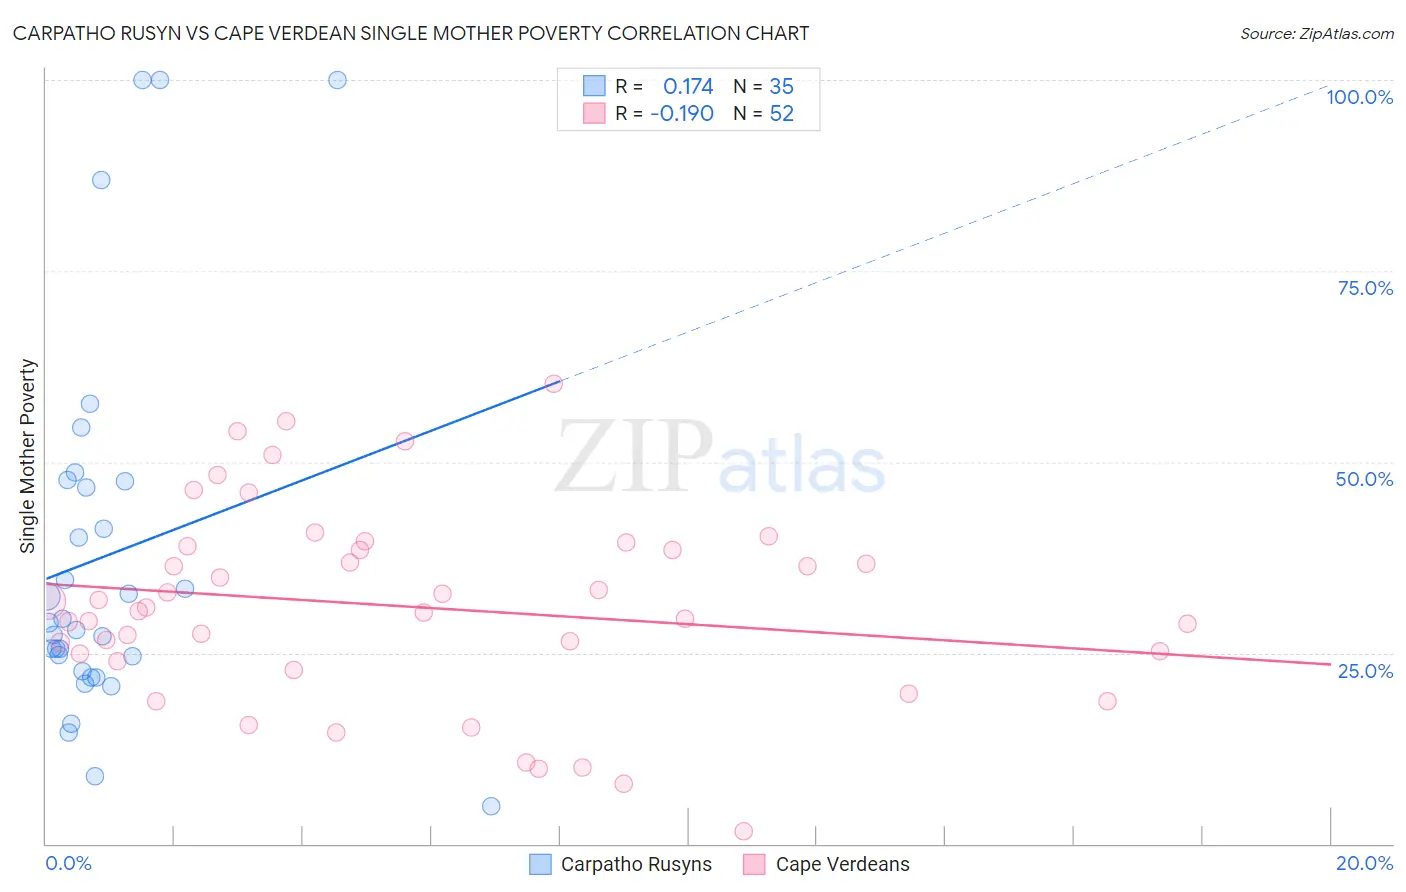
Carpatho Rusyn vs Cape Verdean Single Mother Poverty Correlation Chart
The statistical analysis conducted on geographies consisting of 58,401,773 people shows a poor positive correlation between the proportion of Carpatho Rusyns and poverty level among single mothers in the United States with a correlation coefficient (R) of 0.174 and weighted average of 29.1%. Similarly, the statistical analysis conducted on geographies consisting of 106,661,229 people shows a poor negative correlation between the proportion of Cape Verdeans and poverty level among single mothers in the United States with a correlation coefficient (R) of -0.190 and weighted average of 30.8%, a difference of 5.9%.
Single Mother Poverty Correlation Summary
| Measurement | Carpatho Rusyn | Cape Verdean |
| Minimum | 4.9% | 1.6% |
| Maximum | 100.0% | 60.3% |
| Range | 95.1% | 58.7% |
| Mean | 37.8% | 31.1% |
| Median | 28.9% | 30.7% |
| Interquartile 25% (IQ1) | 22.6% | 24.4% |
| Interquartile 75% (IQ3) | 47.5% | 38.7% |
| Interquartile Range (IQR) | 25.0% | 14.3% |
| Standard Deviation (Sample) | 24.7% | 12.9% |
| Standard Deviation (Population) | 24.3% | 12.8% |
Similar Demographics by Single Mother Poverty
Demographics Similar to Carpatho Rusyns by Single Mother Poverty
In terms of single mother poverty, the demographic groups most similar to Carpatho Rusyns are New Zealander (29.1%, a difference of 0.060%), Puget Sound Salish (29.1%, a difference of 0.060%), British (29.2%, a difference of 0.16%), Immigrants from Uruguay (29.1%, a difference of 0.17%), and European (29.1%, a difference of 0.18%).
| Demographics | Rating | Rank | Single Mother Poverty |
| Arabs | 60.7 /100 | #165 | Good 29.0% |
| Inupiat | 60.4 /100 | #166 | Good 29.0% |
| Costa Ricans | 58.4 /100 | #167 | Average 29.0% |
| Europeans | 57.6 /100 | #168 | Average 29.1% |
| Immigrants | Uruguay | 57.2 /100 | #169 | Average 29.1% |
| New Zealanders | 55.1 /100 | #170 | Average 29.1% |
| Puget Sound Salish | 55.1 /100 | #171 | Average 29.1% |
| Carpatho Rusyns | 53.8 /100 | #172 | Average 29.1% |
| British | 50.6 /100 | #173 | Average 29.2% |
| Immigrants | Saudi Arabia | 50.0 /100 | #174 | Average 29.2% |
| Immigrants | Costa Rica | 48.8 /100 | #175 | Average 29.2% |
| Hawaiians | 47.8 /100 | #176 | Average 29.2% |
| Immigrants | Bosnia and Herzegovina | 45.1 /100 | #177 | Average 29.2% |
| South American Indians | 43.2 /100 | #178 | Average 29.3% |
| Immigrants | Uzbekistan | 42.6 /100 | #179 | Average 29.3% |
Demographics Similar to Cape Verdeans by Single Mother Poverty
In terms of single mother poverty, the demographic groups most similar to Cape Verdeans are French Canadian (30.8%, a difference of 0.080%), West Indian (30.8%, a difference of 0.12%), Ecuadorian (30.8%, a difference of 0.15%), Vietnamese (30.9%, a difference of 0.15%), and Tlingit-Haida (30.9%, a difference of 0.27%).
| Demographics | Rating | Rank | Single Mother Poverty |
| Immigrants | Burma/Myanmar | 1.7 /100 | #242 | Tragic 30.6% |
| Bermudans | 1.6 /100 | #243 | Tragic 30.6% |
| French | 1.3 /100 | #244 | Tragic 30.7% |
| Barbadians | 1.3 /100 | #245 | Tragic 30.7% |
| Ecuadorians | 0.9 /100 | #246 | Tragic 30.8% |
| West Indians | 0.9 /100 | #247 | Tragic 30.8% |
| French Canadians | 0.9 /100 | #248 | Tragic 30.8% |
| Cape Verdeans | 0.8 /100 | #249 | Tragic 30.8% |
| Vietnamese | 0.7 /100 | #250 | Tragic 30.9% |
| Tlingit-Haida | 0.6 /100 | #251 | Tragic 30.9% |
| Alaska Natives | 0.6 /100 | #252 | Tragic 30.9% |
| Celtics | 0.6 /100 | #253 | Tragic 30.9% |
| Senegalese | 0.5 /100 | #254 | Tragic 31.0% |
| Belizeans | 0.5 /100 | #255 | Tragic 31.0% |
| Immigrants | West Indies | 0.4 /100 | #256 | Tragic 31.1% |