Luxembourger vs Tlingit-Haida Seniors Poverty Over the Age of 75
COMPARE
Luxembourger
Tlingit-Haida
Seniors Poverty Over the Age of 75
Seniors Poverty Over the Age of 75 Comparison
Luxembourgers
Tlingit-Haida
10.8%
SENIORS POVERTY OVER THE AGE OF 75
99.6/ 100
METRIC RATING
35th/ 347
METRIC RANK
9.7%
SENIORS POVERTY OVER THE AGE OF 75
100.0/ 100
METRIC RATING
2nd/ 347
METRIC RANK
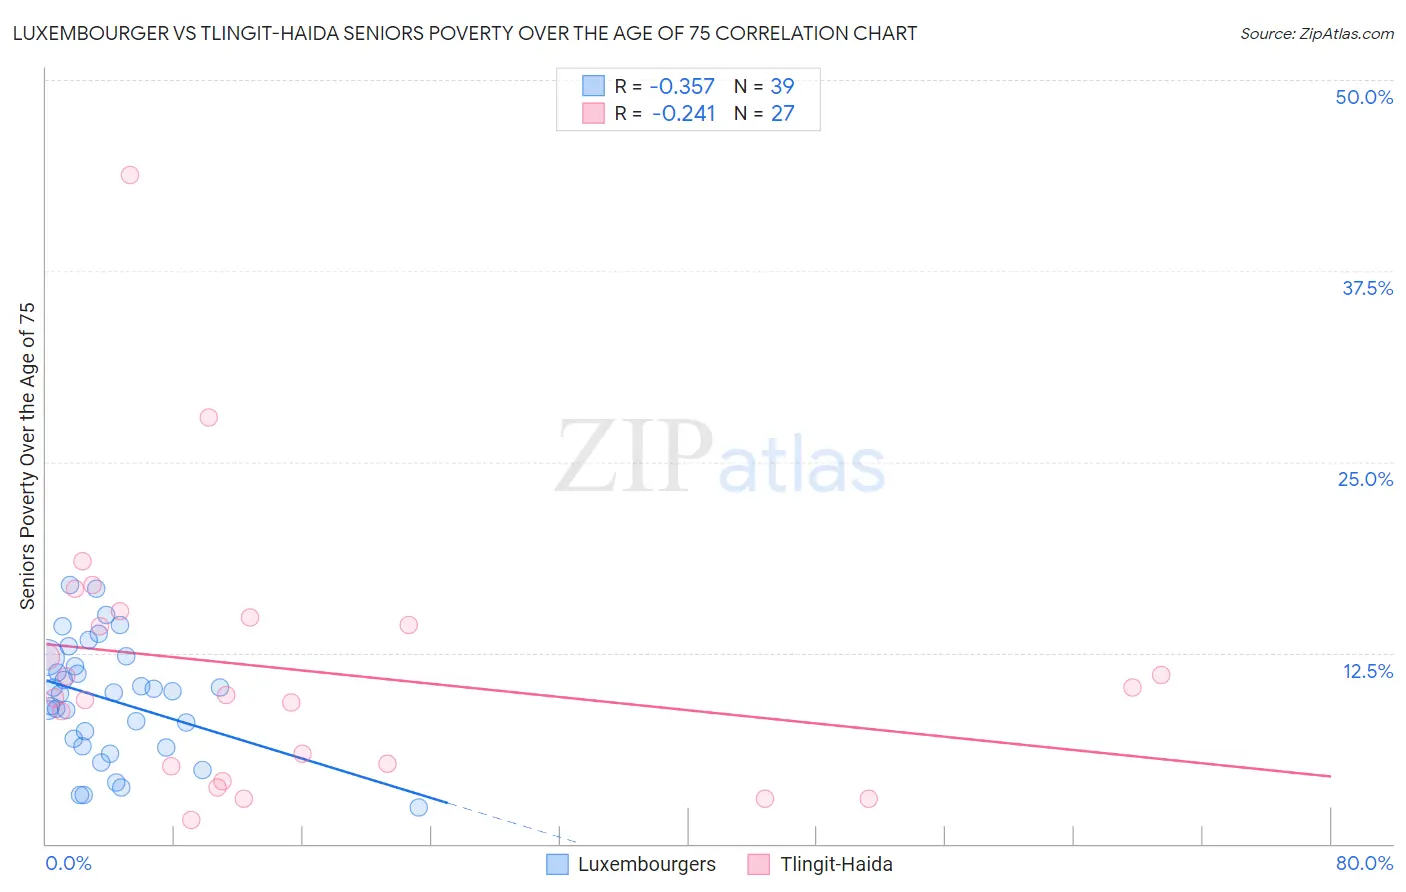
Luxembourger vs Tlingit-Haida Seniors Poverty Over the Age of 75 Correlation Chart
The statistical analysis conducted on geographies consisting of 143,842,959 people shows a mild negative correlation between the proportion of Luxembourgers and poverty level among seniors over the age of 75 in the United States with a correlation coefficient (R) of -0.357 and weighted average of 10.8%. Similarly, the statistical analysis conducted on geographies consisting of 60,526,405 people shows a weak negative correlation between the proportion of Tlingit-Haida and poverty level among seniors over the age of 75 in the United States with a correlation coefficient (R) of -0.241 and weighted average of 9.7%, a difference of 11.3%.
Seniors Poverty Over the Age of 75 Correlation Summary
| Measurement | Luxembourger | Tlingit-Haida |
| Minimum | 2.4% | 1.5% |
| Maximum | 16.9% | 43.8% |
| Range | 14.5% | 42.2% |
| Mean | 9.4% | 11.4% |
| Median | 9.9% | 9.7% |
| Interquartile 25% (IQ1) | 6.4% | 5.0% |
| Interquartile 75% (IQ3) | 12.2% | 14.8% |
| Interquartile Range (IQR) | 5.8% | 9.8% |
| Standard Deviation (Sample) | 3.8% | 8.8% |
| Standard Deviation (Population) | 3.7% | 8.7% |
Similar Demographics by Seniors Poverty Over the Age of 75
Demographics Similar to Luxembourgers by Seniors Poverty Over the Age of 75
In terms of seniors poverty over the age of 75, the demographic groups most similar to Luxembourgers are Scotch-Irish (10.8%, a difference of 0.050%), Latvian (10.8%, a difference of 0.21%), Finnish (10.8%, a difference of 0.35%), Italian (10.8%, a difference of 0.38%), and Puget Sound Salish (10.8%, a difference of 0.44%).
| Demographics | Rating | Rank | Seniors Poverty Over the Age of 75 |
| Irish | 99.8 /100 | #28 | Exceptional 10.7% |
| Assyrians/Chaldeans/Syriacs | 99.8 /100 | #29 | Exceptional 10.7% |
| Swiss | 99.7 /100 | #30 | Exceptional 10.7% |
| Marshallese | 99.7 /100 | #31 | Exceptional 10.7% |
| British | 99.7 /100 | #32 | Exceptional 10.7% |
| Puget Sound Salish | 99.7 /100 | #33 | Exceptional 10.8% |
| Italians | 99.7 /100 | #34 | Exceptional 10.8% |
| Luxembourgers | 99.6 /100 | #35 | Exceptional 10.8% |
| Scotch-Irish | 99.6 /100 | #36 | Exceptional 10.8% |
| Latvians | 99.6 /100 | #37 | Exceptional 10.8% |
| Finns | 99.6 /100 | #38 | Exceptional 10.8% |
| Czechoslovakians | 99.4 /100 | #39 | Exceptional 10.9% |
| Thais | 99.4 /100 | #40 | Exceptional 10.9% |
| Immigrants | Lithuania | 99.2 /100 | #41 | Exceptional 11.0% |
| Austrians | 99.1 /100 | #42 | Exceptional 11.0% |
Demographics Similar to Tlingit-Haida by Seniors Poverty Over the Age of 75
In terms of seniors poverty over the age of 75, the demographic groups most similar to Tlingit-Haida are Native Hawaiian (10.1%, a difference of 3.8%), Swedish (10.2%, a difference of 4.7%), Norwegian (10.2%, a difference of 5.1%), Danish (10.2%, a difference of 5.4%), and Maltese (10.3%, a difference of 6.1%).
| Demographics | Rating | Rank | Seniors Poverty Over the Age of 75 |
| Chinese | 100.0 /100 | #1 | Exceptional 9.1% |
| Tlingit-Haida | 100.0 /100 | #2 | Exceptional 9.7% |
| Native Hawaiians | 100.0 /100 | #3 | Exceptional 10.1% |
| Swedes | 100.0 /100 | #4 | Exceptional 10.2% |
| Norwegians | 100.0 /100 | #5 | Exceptional 10.2% |
| Danes | 100.0 /100 | #6 | Exceptional 10.2% |
| Maltese | 100.0 /100 | #7 | Exceptional 10.3% |
| Germans | 99.9 /100 | #8 | Exceptional 10.4% |
| English | 99.9 /100 | #9 | Exceptional 10.4% |
| Scandinavians | 99.9 /100 | #10 | Exceptional 10.4% |
| Immigrants | India | 99.9 /100 | #11 | Exceptional 10.4% |
| Tongans | 99.9 /100 | #12 | Exceptional 10.5% |
| Croatians | 99.9 /100 | #13 | Exceptional 10.5% |
| Scottish | 99.9 /100 | #14 | Exceptional 10.5% |
| Europeans | 99.9 /100 | #15 | Exceptional 10.5% |