Luxembourger vs Immigrants from France Seniors Poverty Over the Age of 75
COMPARE
Luxembourger
Immigrants from France
Seniors Poverty Over the Age of 75
Seniors Poverty Over the Age of 75 Comparison
Luxembourgers
Immigrants from France
10.8%
SENIORS POVERTY OVER THE AGE OF 75
99.6/ 100
METRIC RATING
35th/ 347
METRIC RANK
12.6%
SENIORS POVERTY OVER THE AGE OF 75
17.4/ 100
METRIC RATING
195th/ 347
METRIC RANK
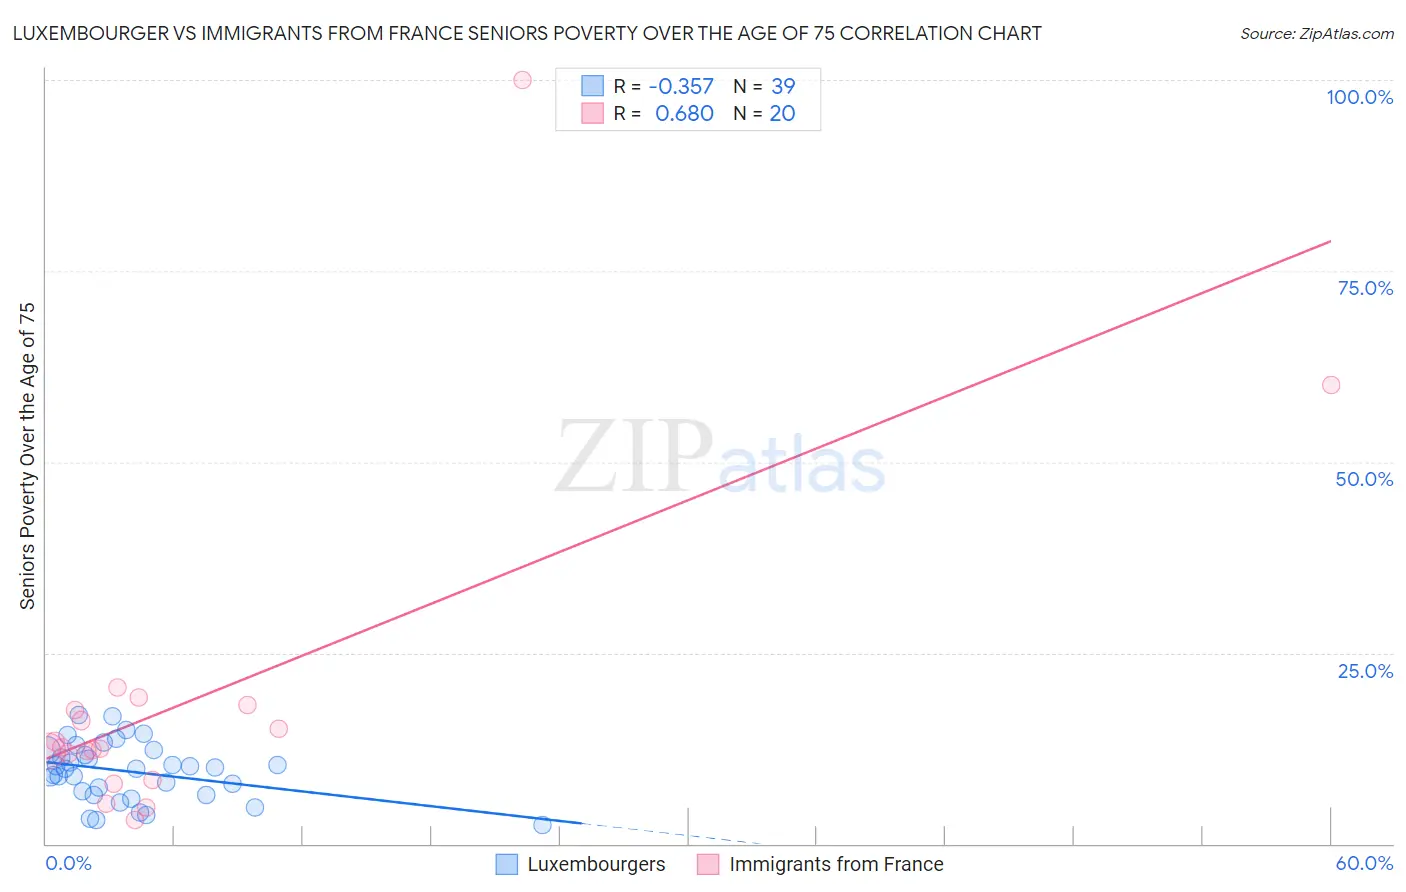
Luxembourger vs Immigrants from France Seniors Poverty Over the Age of 75 Correlation Chart
The statistical analysis conducted on geographies consisting of 143,842,959 people shows a mild negative correlation between the proportion of Luxembourgers and poverty level among seniors over the age of 75 in the United States with a correlation coefficient (R) of -0.357 and weighted average of 10.8%. Similarly, the statistical analysis conducted on geographies consisting of 285,746,787 people shows a significant positive correlation between the proportion of Immigrants from France and poverty level among seniors over the age of 75 in the United States with a correlation coefficient (R) of 0.680 and weighted average of 12.6%, a difference of 16.4%.
Seniors Poverty Over the Age of 75 Correlation Summary
| Measurement | Luxembourger | Immigrants from France |
| Minimum | 2.4% | 3.2% |
| Maximum | 16.9% | 100.0% |
| Range | 14.5% | 96.8% |
| Mean | 9.4% | 19.1% |
| Median | 9.9% | 12.5% |
| Interquartile 25% (IQ1) | 6.4% | 10.0% |
| Interquartile 75% (IQ3) | 12.2% | 17.8% |
| Interquartile Range (IQR) | 5.8% | 7.8% |
| Standard Deviation (Sample) | 3.8% | 22.3% |
| Standard Deviation (Population) | 3.7% | 21.7% |
Similar Demographics by Seniors Poverty Over the Age of 75
Demographics Similar to Luxembourgers by Seniors Poverty Over the Age of 75
In terms of seniors poverty over the age of 75, the demographic groups most similar to Luxembourgers are Scotch-Irish (10.8%, a difference of 0.050%), Latvian (10.8%, a difference of 0.21%), Finnish (10.8%, a difference of 0.35%), Italian (10.8%, a difference of 0.38%), and Puget Sound Salish (10.8%, a difference of 0.44%).
| Demographics | Rating | Rank | Seniors Poverty Over the Age of 75 |
| Irish | 99.8 /100 | #28 | Exceptional 10.7% |
| Assyrians/Chaldeans/Syriacs | 99.8 /100 | #29 | Exceptional 10.7% |
| Swiss | 99.7 /100 | #30 | Exceptional 10.7% |
| Marshallese | 99.7 /100 | #31 | Exceptional 10.7% |
| British | 99.7 /100 | #32 | Exceptional 10.7% |
| Puget Sound Salish | 99.7 /100 | #33 | Exceptional 10.8% |
| Italians | 99.7 /100 | #34 | Exceptional 10.8% |
| Luxembourgers | 99.6 /100 | #35 | Exceptional 10.8% |
| Scotch-Irish | 99.6 /100 | #36 | Exceptional 10.8% |
| Latvians | 99.6 /100 | #37 | Exceptional 10.8% |
| Finns | 99.6 /100 | #38 | Exceptional 10.8% |
| Czechoslovakians | 99.4 /100 | #39 | Exceptional 10.9% |
| Thais | 99.4 /100 | #40 | Exceptional 10.9% |
| Immigrants | Lithuania | 99.2 /100 | #41 | Exceptional 11.0% |
| Austrians | 99.1 /100 | #42 | Exceptional 11.0% |
Demographics Similar to Immigrants from France by Seniors Poverty Over the Age of 75
In terms of seniors poverty over the age of 75, the demographic groups most similar to Immigrants from France are Alsatian (12.6%, a difference of 0.050%), Taiwanese (12.6%, a difference of 0.060%), Immigrants from Eastern Europe (12.6%, a difference of 0.19%), Choctaw (12.5%, a difference of 0.37%), and Nepalese (12.6%, a difference of 0.44%).
| Demographics | Rating | Rank | Seniors Poverty Over the Age of 75 |
| Immigrants | Northern Africa | 25.2 /100 | #188 | Fair 12.5% |
| Immigrants | Indonesia | 24.4 /100 | #189 | Fair 12.5% |
| Immigrants | Congo | 23.9 /100 | #190 | Fair 12.5% |
| Liberians | 23.2 /100 | #191 | Fair 12.5% |
| Choctaw | 20.2 /100 | #192 | Fair 12.5% |
| Taiwanese | 17.8 /100 | #193 | Poor 12.6% |
| Alsatians | 17.7 /100 | #194 | Poor 12.6% |
| Immigrants | France | 17.4 /100 | #195 | Poor 12.6% |
| Immigrants | Eastern Europe | 16.0 /100 | #196 | Poor 12.6% |
| Nepalese | 14.4 /100 | #197 | Poor 12.6% |
| Chileans | 13.7 /100 | #198 | Poor 12.6% |
| Immigrants | Lebanon | 12.7 /100 | #199 | Poor 12.7% |
| Immigrants | Vietnam | 12.1 /100 | #200 | Poor 12.7% |
| Paraguayans | 11.1 /100 | #201 | Poor 12.7% |
| Arapaho | 10.9 /100 | #202 | Poor 12.7% |