Luxembourger vs Immigrants from Northern Europe Seniors Poverty Over the Age of 75
COMPARE
Luxembourger
Immigrants from Northern Europe
Seniors Poverty Over the Age of 75
Seniors Poverty Over the Age of 75 Comparison
Luxembourgers
Immigrants from Northern Europe
10.8%
SENIORS POVERTY OVER THE AGE OF 75
99.6/ 100
METRIC RATING
35th/ 347
METRIC RANK
11.3%
SENIORS POVERTY OVER THE AGE OF 75
97.4/ 100
METRIC RATING
64th/ 347
METRIC RANK
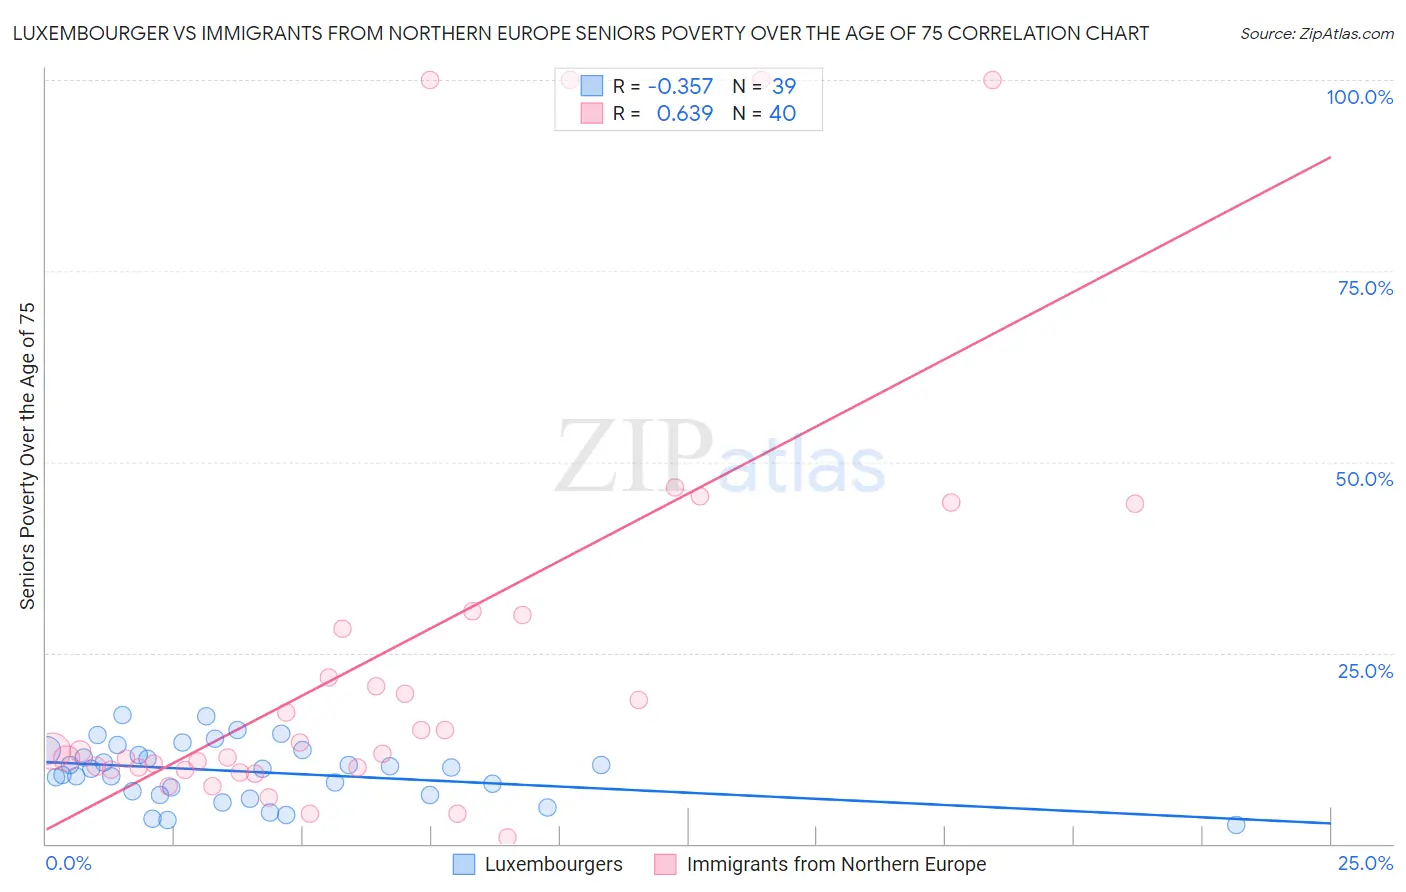
Luxembourger vs Immigrants from Northern Europe Seniors Poverty Over the Age of 75 Correlation Chart
The statistical analysis conducted on geographies consisting of 143,842,959 people shows a mild negative correlation between the proportion of Luxembourgers and poverty level among seniors over the age of 75 in the United States with a correlation coefficient (R) of -0.357 and weighted average of 10.8%. Similarly, the statistical analysis conducted on geographies consisting of 469,237,563 people shows a significant positive correlation between the proportion of Immigrants from Northern Europe and poverty level among seniors over the age of 75 in the United States with a correlation coefficient (R) of 0.639 and weighted average of 11.3%, a difference of 4.6%.
Seniors Poverty Over the Age of 75 Correlation Summary
| Measurement | Luxembourger | Immigrants from Northern Europe |
| Minimum | 2.4% | 0.79% |
| Maximum | 16.9% | 100.0% |
| Range | 14.5% | 99.2% |
| Mean | 9.4% | 25.0% |
| Median | 9.9% | 12.1% |
| Interquartile 25% (IQ1) | 6.4% | 9.8% |
| Interquartile 75% (IQ3) | 12.2% | 29.0% |
| Interquartile Range (IQR) | 5.8% | 19.2% |
| Standard Deviation (Sample) | 3.8% | 27.9% |
| Standard Deviation (Population) | 3.7% | 27.5% |
Similar Demographics by Seniors Poverty Over the Age of 75
Demographics Similar to Luxembourgers by Seniors Poverty Over the Age of 75
In terms of seniors poverty over the age of 75, the demographic groups most similar to Luxembourgers are Scotch-Irish (10.8%, a difference of 0.050%), Latvian (10.8%, a difference of 0.21%), Finnish (10.8%, a difference of 0.35%), Italian (10.8%, a difference of 0.38%), and Puget Sound Salish (10.8%, a difference of 0.44%).
| Demographics | Rating | Rank | Seniors Poverty Over the Age of 75 |
| Irish | 99.8 /100 | #28 | Exceptional 10.7% |
| Assyrians/Chaldeans/Syriacs | 99.8 /100 | #29 | Exceptional 10.7% |
| Swiss | 99.7 /100 | #30 | Exceptional 10.7% |
| Marshallese | 99.7 /100 | #31 | Exceptional 10.7% |
| British | 99.7 /100 | #32 | Exceptional 10.7% |
| Puget Sound Salish | 99.7 /100 | #33 | Exceptional 10.8% |
| Italians | 99.7 /100 | #34 | Exceptional 10.8% |
| Luxembourgers | 99.6 /100 | #35 | Exceptional 10.8% |
| Scotch-Irish | 99.6 /100 | #36 | Exceptional 10.8% |
| Latvians | 99.6 /100 | #37 | Exceptional 10.8% |
| Finns | 99.6 /100 | #38 | Exceptional 10.8% |
| Czechoslovakians | 99.4 /100 | #39 | Exceptional 10.9% |
| Thais | 99.4 /100 | #40 | Exceptional 10.9% |
| Immigrants | Lithuania | 99.2 /100 | #41 | Exceptional 11.0% |
| Austrians | 99.1 /100 | #42 | Exceptional 11.0% |
Demographics Similar to Immigrants from Northern Europe by Seniors Poverty Over the Age of 75
In terms of seniors poverty over the age of 75, the demographic groups most similar to Immigrants from Northern Europe are Immigrants from Afghanistan (11.3%, a difference of 0.14%), Immigrants from North America (11.3%, a difference of 0.18%), Canadian (11.3%, a difference of 0.28%), Eastern European (11.3%, a difference of 0.31%), and Immigrants from Netherlands (11.2%, a difference of 0.42%).
| Demographics | Rating | Rank | Seniors Poverty Over the Age of 75 |
| Immigrants | Canada | 97.9 /100 | #57 | Exceptional 11.2% |
| Yugoslavians | 97.9 /100 | #58 | Exceptional 11.2% |
| Immigrants | Netherlands | 97.8 /100 | #59 | Exceptional 11.2% |
| Eastern Europeans | 97.7 /100 | #60 | Exceptional 11.3% |
| Canadians | 97.7 /100 | #61 | Exceptional 11.3% |
| Immigrants | North America | 97.6 /100 | #62 | Exceptional 11.3% |
| Immigrants | Afghanistan | 97.5 /100 | #63 | Exceptional 11.3% |
| Immigrants | Northern Europe | 97.4 /100 | #64 | Exceptional 11.3% |
| Immigrants | Taiwan | 96.7 /100 | #65 | Exceptional 11.4% |
| Estonians | 96.7 /100 | #66 | Exceptional 11.4% |
| Bolivians | 96.5 /100 | #67 | Exceptional 11.4% |
| Immigrants | Austria | 96.5 /100 | #68 | Exceptional 11.4% |
| Ottawa | 96.5 /100 | #69 | Exceptional 11.4% |
| Immigrants | South Central Asia | 96.4 /100 | #70 | Exceptional 11.4% |
| Osage | 96.3 /100 | #71 | Exceptional 11.4% |