Lumbee vs Cape Verdean Child Poverty Among Boys Under 16
COMPARE
Lumbee
Cape Verdean
Child Poverty Among Boys Under 16
Child Poverty Among Boys Under 16 Comparison
Lumbee
Cape Verdeans
31.9%
CHILD POVERTY AMONG BOYS UNDER 16
0.0/ 100
METRIC RATING
346th/ 347
METRIC RANK
18.7%
CHILD POVERTY AMONG BOYS UNDER 16
0.7/ 100
METRIC RATING
239th/ 347
METRIC RANK
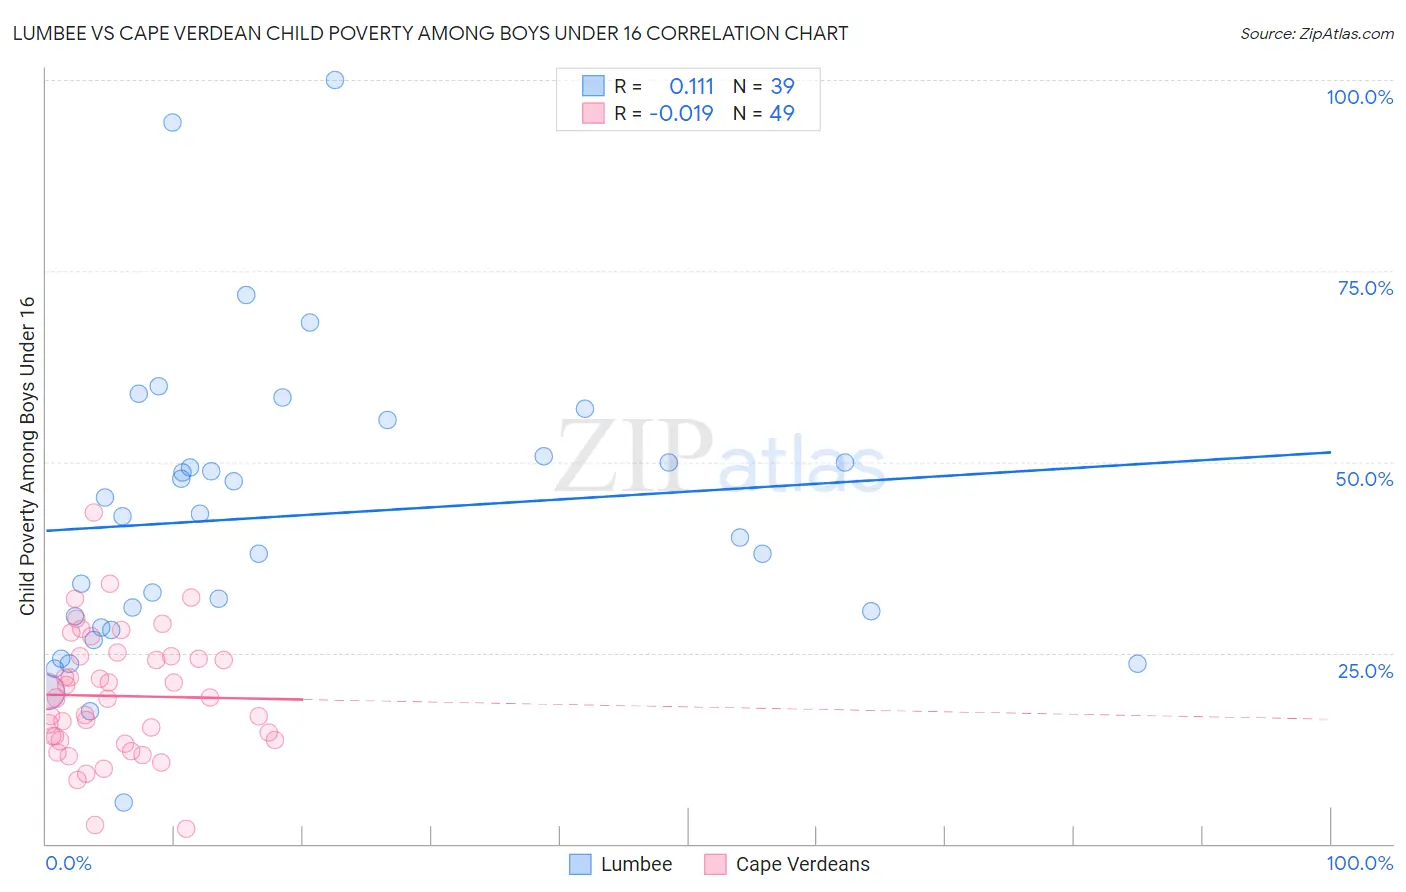
Lumbee vs Cape Verdean Child Poverty Among Boys Under 16 Correlation Chart
The statistical analysis conducted on geographies consisting of 91,775,991 people shows a poor positive correlation between the proportion of Lumbee and poverty level among boys under the age of 16 in the United States with a correlation coefficient (R) of 0.111 and weighted average of 31.9%. Similarly, the statistical analysis conducted on geographies consisting of 106,786,125 people shows no correlation between the proportion of Cape Verdeans and poverty level among boys under the age of 16 in the United States with a correlation coefficient (R) of -0.019 and weighted average of 18.7%, a difference of 70.6%.
Child Poverty Among Boys Under 16 Correlation Summary
| Measurement | Lumbee | Cape Verdean |
| Minimum | 5.4% | 1.9% |
| Maximum | 100.0% | 43.4% |
| Range | 94.6% | 41.5% |
| Mean | 42.9% | 19.3% |
| Median | 42.9% | 19.1% |
| Interquartile 25% (IQ1) | 28.2% | 13.6% |
| Interquartile 75% (IQ3) | 50.7% | 24.5% |
| Interquartile Range (IQR) | 22.4% | 10.9% |
| Standard Deviation (Sample) | 19.5% | 8.2% |
| Standard Deviation (Population) | 19.3% | 8.1% |
Similar Demographics by Child Poverty Among Boys Under 16
Demographics Similar to Lumbee by Child Poverty Among Boys Under 16
In terms of child poverty among boys under 16, the demographic groups most similar to Lumbee are Tohono O'odham (31.6%, a difference of 1.1%), Puerto Rican (32.8%, a difference of 2.9%), Yuman (30.6%, a difference of 4.2%), Navajo (30.3%, a difference of 5.4%), and Pima (29.7%, a difference of 7.3%).
| Demographics | Rating | Rank | Child Poverty Among Boys Under 16 |
| Apache | 0.0 /100 | #333 | Tragic 24.5% |
| Blacks/African Americans | 0.0 /100 | #334 | Tragic 24.5% |
| Yup'ik | 0.0 /100 | #335 | Tragic 24.7% |
| Sioux | 0.0 /100 | #336 | Tragic 25.3% |
| Cheyenne | 0.0 /100 | #337 | Tragic 25.8% |
| Hopi | 0.0 /100 | #338 | Tragic 25.9% |
| Houma | 0.0 /100 | #339 | Tragic 26.2% |
| Crow | 0.0 /100 | #340 | Tragic 26.3% |
| Immigrants | Yemen | 0.0 /100 | #341 | Tragic 28.9% |
| Pima | 0.0 /100 | #342 | Tragic 29.7% |
| Navajo | 0.0 /100 | #343 | Tragic 30.3% |
| Yuman | 0.0 /100 | #344 | Tragic 30.6% |
| Tohono O'odham | 0.0 /100 | #345 | Tragic 31.6% |
| Lumbee | 0.0 /100 | #346 | Tragic 31.9% |
| Puerto Ricans | 0.0 /100 | #347 | Tragic 32.8% |
Demographics Similar to Cape Verdeans by Child Poverty Among Boys Under 16
In terms of child poverty among boys under 16, the demographic groups most similar to Cape Verdeans are Immigrants from Laos (18.7%, a difference of 0.24%), Immigrants from Cuba (18.8%, a difference of 0.34%), Immigrants from Sudan (18.8%, a difference of 0.39%), Immigrants from Eritrea (18.6%, a difference of 0.45%), and Sudanese (18.6%, a difference of 0.61%).
| Demographics | Rating | Rank | Child Poverty Among Boys Under 16 |
| Marshallese | 1.3 /100 | #232 | Tragic 18.4% |
| Immigrants | Nigeria | 1.2 /100 | #233 | Tragic 18.4% |
| Nigerians | 1.1 /100 | #234 | Tragic 18.5% |
| Americans | 0.9 /100 | #235 | Tragic 18.6% |
| Sudanese | 0.9 /100 | #236 | Tragic 18.6% |
| Immigrants | Eritrea | 0.8 /100 | #237 | Tragic 18.6% |
| Immigrants | Laos | 0.8 /100 | #238 | Tragic 18.7% |
| Cape Verdeans | 0.7 /100 | #239 | Tragic 18.7% |
| Immigrants | Cuba | 0.6 /100 | #240 | Tragic 18.8% |
| Immigrants | Sudan | 0.6 /100 | #241 | Tragic 18.8% |
| Ghanaians | 0.5 /100 | #242 | Tragic 18.9% |
| Immigrants | Azores | 0.4 /100 | #243 | Tragic 18.9% |
| Immigrants | Middle Africa | 0.4 /100 | #244 | Tragic 18.9% |
| Cree | 0.4 /100 | #245 | Tragic 19.0% |
| Immigrants | Nicaragua | 0.4 /100 | #246 | Tragic 19.0% |