Immigrants from Zimbabwe vs Cape Verdean Child Poverty Among Boys Under 16
COMPARE
Immigrants from Zimbabwe
Cape Verdean
Child Poverty Among Boys Under 16
Child Poverty Among Boys Under 16 Comparison
Immigrants from Zimbabwe
Cape Verdeans
15.2%
CHILD POVERTY AMONG BOYS UNDER 16
94.2/ 100
METRIC RATING
111th/ 347
METRIC RANK
18.7%
CHILD POVERTY AMONG BOYS UNDER 16
0.7/ 100
METRIC RATING
239th/ 347
METRIC RANK
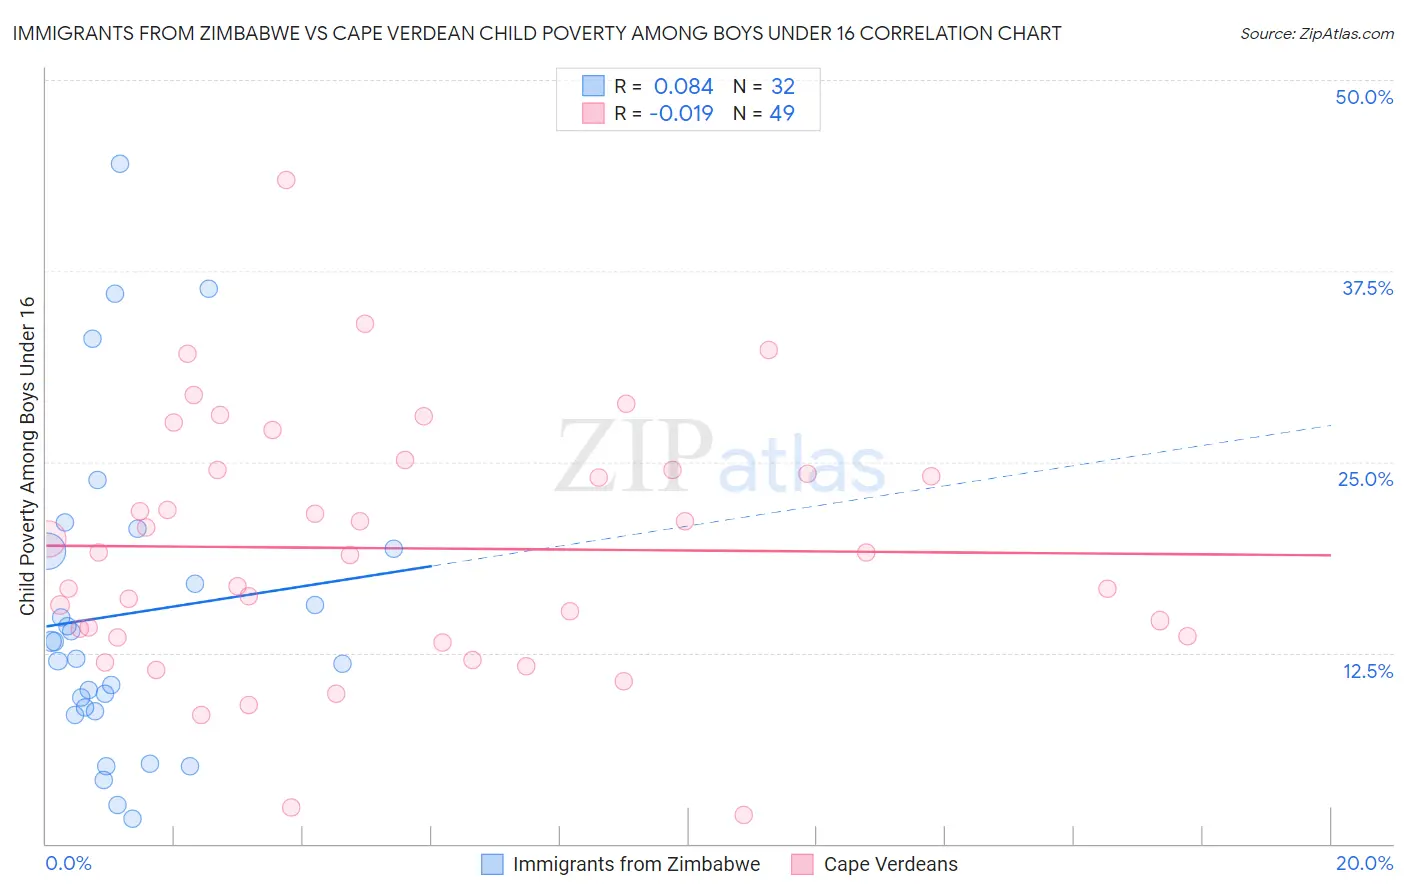
Immigrants from Zimbabwe vs Cape Verdean Child Poverty Among Boys Under 16 Correlation Chart
The statistical analysis conducted on geographies consisting of 117,351,792 people shows a slight positive correlation between the proportion of Immigrants from Zimbabwe and poverty level among boys under the age of 16 in the United States with a correlation coefficient (R) of 0.084 and weighted average of 15.2%. Similarly, the statistical analysis conducted on geographies consisting of 106,786,125 people shows no correlation between the proportion of Cape Verdeans and poverty level among boys under the age of 16 in the United States with a correlation coefficient (R) of -0.019 and weighted average of 18.7%, a difference of 23.5%.
Child Poverty Among Boys Under 16 Correlation Summary
| Measurement | Immigrants from Zimbabwe | Cape Verdean |
| Minimum | 1.6% | 1.9% |
| Maximum | 44.5% | 43.4% |
| Range | 42.9% | 41.5% |
| Mean | 15.0% | 19.3% |
| Median | 12.7% | 19.1% |
| Interquartile 25% (IQ1) | 8.8% | 13.6% |
| Interquartile 75% (IQ3) | 19.2% | 24.5% |
| Interquartile Range (IQR) | 10.4% | 10.9% |
| Standard Deviation (Sample) | 10.3% | 8.2% |
| Standard Deviation (Population) | 10.1% | 8.1% |
Similar Demographics by Child Poverty Among Boys Under 16
Demographics Similar to Immigrants from Zimbabwe by Child Poverty Among Boys Under 16
In terms of child poverty among boys under 16, the demographic groups most similar to Immigrants from Zimbabwe are English (15.1%, a difference of 0.050%), Basque (15.2%, a difference of 0.20%), Irish (15.2%, a difference of 0.24%), Immigrants from Ukraine (15.2%, a difference of 0.29%), and Pakistani (15.1%, a difference of 0.31%).
| Demographics | Rating | Rank | Child Poverty Among Boys Under 16 |
| Immigrants | Switzerland | 95.4 /100 | #104 | Exceptional 15.0% |
| Dutch | 95.4 /100 | #105 | Exceptional 15.0% |
| Serbians | 95.2 /100 | #106 | Exceptional 15.1% |
| Jordanians | 95.1 /100 | #107 | Exceptional 15.1% |
| Immigrants | England | 94.8 /100 | #108 | Exceptional 15.1% |
| Pakistanis | 94.7 /100 | #109 | Exceptional 15.1% |
| English | 94.3 /100 | #110 | Exceptional 15.1% |
| Immigrants | Zimbabwe | 94.2 /100 | #111 | Exceptional 15.2% |
| Basques | 93.8 /100 | #112 | Exceptional 15.2% |
| Irish | 93.8 /100 | #113 | Exceptional 15.2% |
| Immigrants | Ukraine | 93.6 /100 | #114 | Exceptional 15.2% |
| Armenians | 93.6 /100 | #115 | Exceptional 15.2% |
| Immigrants | South Eastern Asia | 93.5 /100 | #116 | Exceptional 15.2% |
| Immigrants | Vietnam | 93.5 /100 | #117 | Exceptional 15.2% |
| Native Hawaiians | 93.4 /100 | #118 | Exceptional 15.2% |
Demographics Similar to Cape Verdeans by Child Poverty Among Boys Under 16
In terms of child poverty among boys under 16, the demographic groups most similar to Cape Verdeans are Immigrants from Laos (18.7%, a difference of 0.24%), Immigrants from Cuba (18.8%, a difference of 0.34%), Immigrants from Sudan (18.8%, a difference of 0.39%), Immigrants from Eritrea (18.6%, a difference of 0.45%), and Sudanese (18.6%, a difference of 0.61%).
| Demographics | Rating | Rank | Child Poverty Among Boys Under 16 |
| Marshallese | 1.3 /100 | #232 | Tragic 18.4% |
| Immigrants | Nigeria | 1.2 /100 | #233 | Tragic 18.4% |
| Nigerians | 1.1 /100 | #234 | Tragic 18.5% |
| Americans | 0.9 /100 | #235 | Tragic 18.6% |
| Sudanese | 0.9 /100 | #236 | Tragic 18.6% |
| Immigrants | Eritrea | 0.8 /100 | #237 | Tragic 18.6% |
| Immigrants | Laos | 0.8 /100 | #238 | Tragic 18.7% |
| Cape Verdeans | 0.7 /100 | #239 | Tragic 18.7% |
| Immigrants | Cuba | 0.6 /100 | #240 | Tragic 18.8% |
| Immigrants | Sudan | 0.6 /100 | #241 | Tragic 18.8% |
| Ghanaians | 0.5 /100 | #242 | Tragic 18.9% |
| Immigrants | Azores | 0.4 /100 | #243 | Tragic 18.9% |
| Immigrants | Middle Africa | 0.4 /100 | #244 | Tragic 18.9% |
| Cree | 0.4 /100 | #245 | Tragic 19.0% |
| Immigrants | Nicaragua | 0.4 /100 | #246 | Tragic 19.0% |