Immigrants from Sudan vs Immigrants from Sierra Leone Seniors Poverty Over the Age of 65
COMPARE
Immigrants from Sudan
Immigrants from Sierra Leone
Seniors Poverty Over the Age of 65
Seniors Poverty Over the Age of 65 Comparison
Immigrants from Sudan
Immigrants from Sierra Leone
10.9%
SENIORS POVERTY OVER THE AGE OF 65
50.0/ 100
METRIC RATING
174th/ 347
METRIC RANK
10.7%
SENIORS POVERTY OVER THE AGE OF 65
71.7/ 100
METRIC RATING
158th/ 347
METRIC RANK
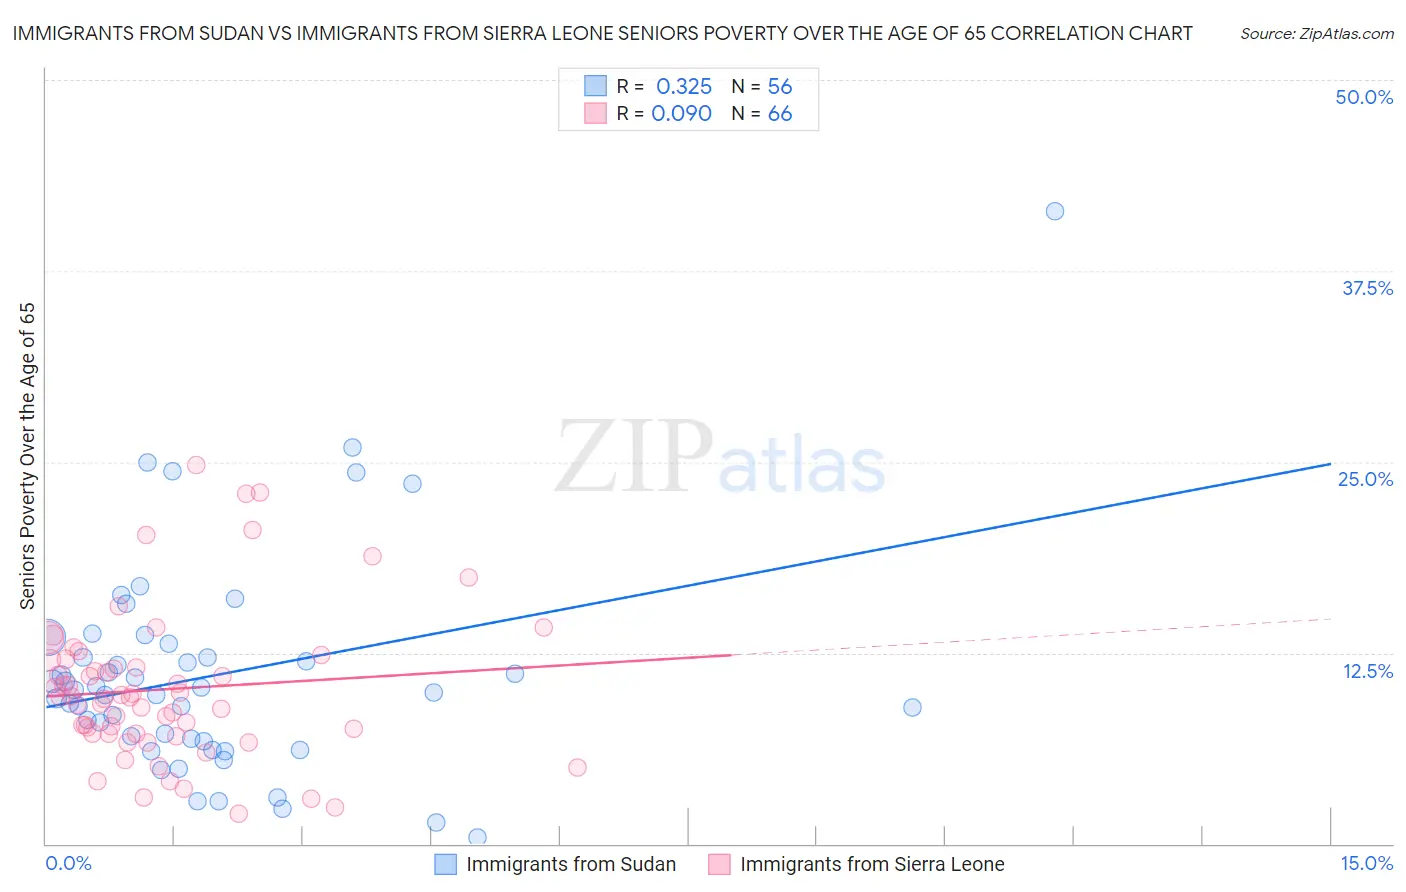
Immigrants from Sudan vs Immigrants from Sierra Leone Seniors Poverty Over the Age of 65 Correlation Chart
The statistical analysis conducted on geographies consisting of 118,879,063 people shows a mild positive correlation between the proportion of Immigrants from Sudan and poverty level among seniors over the age of 65 in the United States with a correlation coefficient (R) of 0.325 and weighted average of 10.9%. Similarly, the statistical analysis conducted on geographies consisting of 101,564,098 people shows a slight positive correlation between the proportion of Immigrants from Sierra Leone and poverty level among seniors over the age of 65 in the United States with a correlation coefficient (R) of 0.090 and weighted average of 10.7%, a difference of 2.1%.
Seniors Poverty Over the Age of 65 Correlation Summary
| Measurement | Immigrants from Sudan | Immigrants from Sierra Leone |
| Minimum | 0.39% | 1.9% |
| Maximum | 41.4% | 24.8% |
| Range | 41.0% | 22.9% |
| Mean | 11.1% | 10.1% |
| Median | 10.0% | 9.6% |
| Interquartile 25% (IQ1) | 6.8% | 7.2% |
| Interquartile 75% (IQ3) | 12.7% | 12.0% |
| Interquartile Range (IQR) | 5.8% | 4.8% |
| Standard Deviation (Sample) | 7.1% | 4.9% |
| Standard Deviation (Population) | 7.1% | 4.9% |
Demographics Similar to Immigrants from Sudan and Immigrants from Sierra Leone by Seniors Poverty Over the Age of 65
In terms of seniors poverty over the age of 65, the demographic groups most similar to Immigrants from Sudan are Creek (10.9%, a difference of 0.040%), Spaniard (10.9%, a difference of 0.070%), Immigrants from Malaysia (11.0%, a difference of 0.19%), Immigrants from Syria (10.9%, a difference of 0.42%), and Nonimmigrants (10.9%, a difference of 0.46%). Similarly, the demographic groups most similar to Immigrants from Sierra Leone are Immigrants from Micronesia (10.7%, a difference of 0.10%), Immigrants from Ethiopia (10.7%, a difference of 0.14%), Ethiopian (10.7%, a difference of 0.15%), Sudanese (10.7%, a difference of 0.37%), and Arab (10.8%, a difference of 0.68%).
| Demographics | Rating | Rank | Seniors Poverty Over the Age of 65 |
| Ethiopians | 72.9 /100 | #156 | Good 10.7% |
| Immigrants | Ethiopia | 72.9 /100 | #157 | Good 10.7% |
| Immigrants | Sierra Leone | 71.7 /100 | #158 | Good 10.7% |
| Immigrants | Micronesia | 70.8 /100 | #159 | Good 10.7% |
| Sudanese | 68.2 /100 | #160 | Good 10.7% |
| Arabs | 65.2 /100 | #161 | Good 10.8% |
| Immigrants | Indonesia | 64.8 /100 | #162 | Good 10.8% |
| Tsimshian | 64.5 /100 | #163 | Good 10.8% |
| Potawatomi | 62.6 /100 | #164 | Good 10.8% |
| Immigrants | South Eastern Asia | 62.1 /100 | #165 | Good 10.8% |
| Malaysians | 62.0 /100 | #166 | Good 10.8% |
| Alaska Natives | 60.3 /100 | #167 | Good 10.8% |
| Mongolians | 58.0 /100 | #168 | Average 10.9% |
| Sri Lankans | 56.8 /100 | #169 | Average 10.9% |
| Immigrants | Eastern Europe | 55.8 /100 | #170 | Average 10.9% |
| Immigrants | Nonimmigrants | 55.1 /100 | #171 | Average 10.9% |
| Immigrants | Syria | 54.7 /100 | #172 | Average 10.9% |
| Spaniards | 50.7 /100 | #173 | Average 10.9% |
| Immigrants | Sudan | 50.0 /100 | #174 | Average 10.9% |
| Creek | 49.6 /100 | #175 | Average 10.9% |
| Immigrants | Malaysia | 47.9 /100 | #176 | Average 11.0% |