Lithuanian vs Icelander 2nd Grade
COMPARE
Lithuanian
Icelander
2nd Grade
2nd Grade Comparison
Lithuanians
Icelanders
98.5%
2ND GRADE
100.0/ 100
METRIC RATING
21st/ 347
METRIC RANK
98.2%
2ND GRADE
99.2/ 100
METRIC RATING
81st/ 347
METRIC RANK
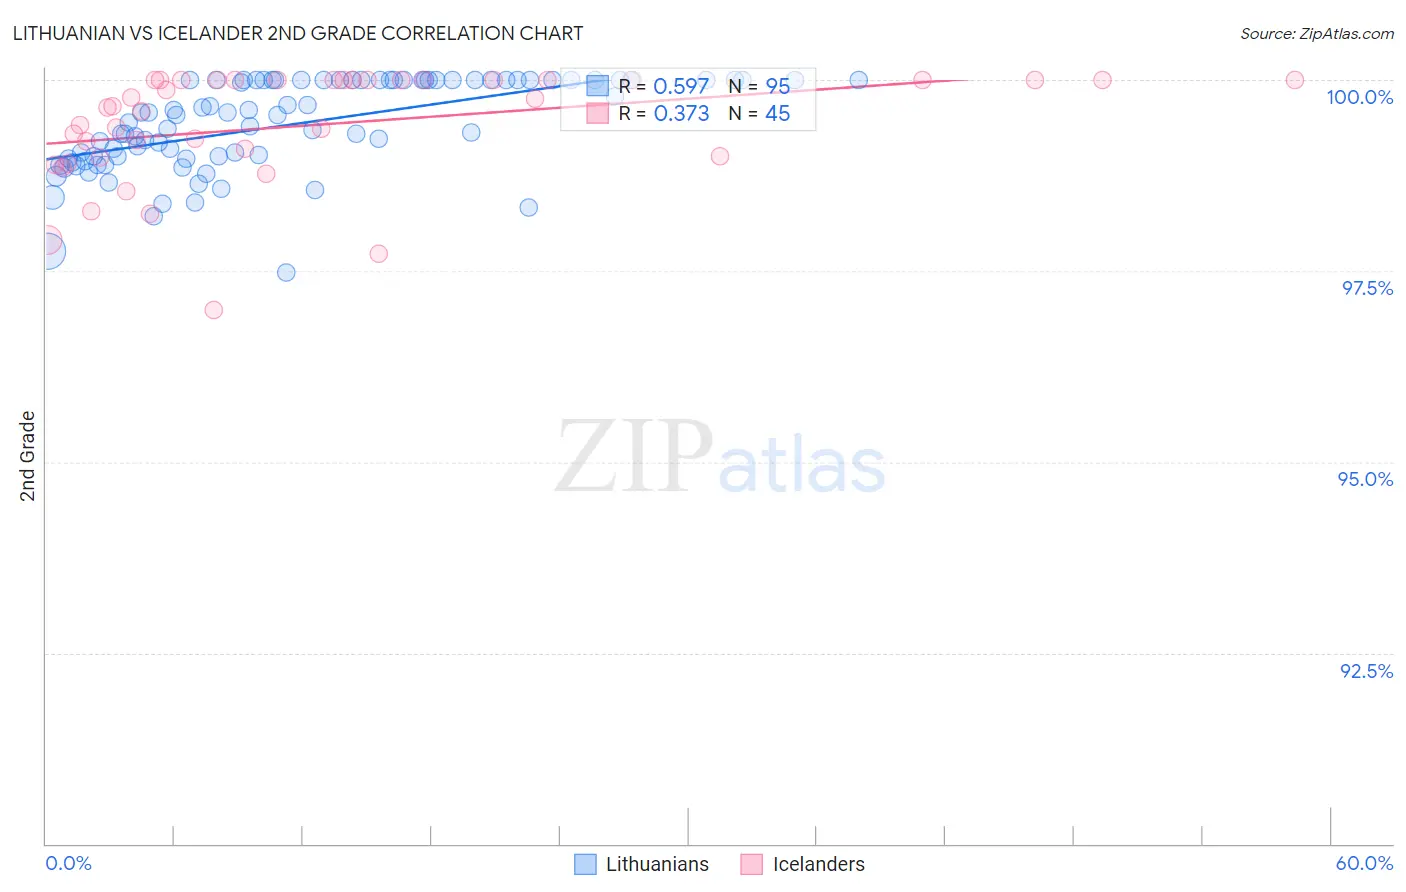
Lithuanian vs Icelander 2nd Grade Correlation Chart
The statistical analysis conducted on geographies consisting of 421,946,231 people shows a substantial positive correlation between the proportion of Lithuanians and percentage of population with at least 2nd grade education in the United States with a correlation coefficient (R) of 0.597 and weighted average of 98.5%. Similarly, the statistical analysis conducted on geographies consisting of 159,668,748 people shows a mild positive correlation between the proportion of Icelanders and percentage of population with at least 2nd grade education in the United States with a correlation coefficient (R) of 0.373 and weighted average of 98.2%, a difference of 0.32%.
2nd Grade Correlation Summary
| Measurement | Lithuanian | Icelander |
| Minimum | 97.5% | 97.0% |
| Maximum | 100.0% | 100.0% |
| Range | 2.5% | 3.0% |
| Mean | 99.4% | 99.4% |
| Median | 99.5% | 99.7% |
| Interquartile 25% (IQ1) | 99.0% | 99.0% |
| Interquartile 75% (IQ3) | 100.0% | 100.0% |
| Interquartile Range (IQR) | 1.0% | 1.0% |
| Standard Deviation (Sample) | 0.59% | 0.73% |
| Standard Deviation (Population) | 0.59% | 0.72% |
Similar Demographics by 2nd Grade
Demographics Similar to Lithuanians by 2nd Grade
In terms of 2nd grade, the demographic groups most similar to Lithuanians are Finnish (98.5%, a difference of 0.0%), Sioux (98.5%, a difference of 0.0%), Polish (98.5%, a difference of 0.0%), Danish (98.5%, a difference of 0.0%), and Pennsylvania German (98.5%, a difference of 0.0%).
| Demographics | Rating | Rank | 2nd Grade |
| Swedes | 100.0 /100 | #14 | Exceptional 98.6% |
| Scottish | 100.0 /100 | #15 | Exceptional 98.6% |
| Dutch | 100.0 /100 | #16 | Exceptional 98.6% |
| Aleuts | 100.0 /100 | #17 | Exceptional 98.6% |
| Irish | 100.0 /100 | #18 | Exceptional 98.6% |
| Finns | 100.0 /100 | #19 | Exceptional 98.5% |
| Sioux | 100.0 /100 | #20 | Exceptional 98.5% |
| Lithuanians | 100.0 /100 | #21 | Exceptional 98.5% |
| Poles | 100.0 /100 | #22 | Exceptional 98.5% |
| Danes | 100.0 /100 | #23 | Exceptional 98.5% |
| Pennsylvania Germans | 100.0 /100 | #24 | Exceptional 98.5% |
| Scotch-Irish | 100.0 /100 | #25 | Exceptional 98.5% |
| Welsh | 100.0 /100 | #26 | Exceptional 98.5% |
| Croatians | 100.0 /100 | #27 | Exceptional 98.5% |
| Arapaho | 100.0 /100 | #28 | Exceptional 98.5% |
Demographics Similar to Icelanders by 2nd Grade
In terms of 2nd grade, the demographic groups most similar to Icelanders are Immigrants from Lithuania (98.2%, a difference of 0.010%), Immigrants from Belgium (98.2%, a difference of 0.010%), Osage (98.2%, a difference of 0.010%), Delaware (98.2%, a difference of 0.010%), and Immigrants from Sweden (98.2%, a difference of 0.010%).
| Demographics | Rating | Rank | 2nd Grade |
| Immigrants | Netherlands | 99.4 /100 | #74 | Exceptional 98.3% |
| Shoshone | 99.4 /100 | #75 | Exceptional 98.3% |
| Cherokee | 99.4 /100 | #76 | Exceptional 98.3% |
| Immigrants | England | 99.4 /100 | #77 | Exceptional 98.3% |
| Immigrants | Lithuania | 99.3 /100 | #78 | Exceptional 98.2% |
| Immigrants | Belgium | 99.3 /100 | #79 | Exceptional 98.2% |
| Osage | 99.2 /100 | #80 | Exceptional 98.2% |
| Icelanders | 99.2 /100 | #81 | Exceptional 98.2% |
| Delaware | 99.1 /100 | #82 | Exceptional 98.2% |
| Immigrants | Sweden | 99.1 /100 | #83 | Exceptional 98.2% |
| Hopi | 99.1 /100 | #84 | Exceptional 98.2% |
| Potawatomi | 99.1 /100 | #85 | Exceptional 98.2% |
| Immigrants | Australia | 99.0 /100 | #86 | Exceptional 98.2% |
| Immigrants | Denmark | 99.0 /100 | #87 | Exceptional 98.2% |
| Macedonians | 99.0 /100 | #88 | Exceptional 98.2% |