Liberian vs Immigrants from Lebanon Child Poverty Under the Age of 16
COMPARE
Liberian
Immigrants from Lebanon
Child Poverty Under the Age of 16
Child Poverty Under the Age of 16 Comparison
Liberians
Immigrants from Lebanon
19.5%
CHILD POVERTY UNDER THE AGE OF 16
0.1/ 100
METRIC RATING
266th/ 347
METRIC RANK
16.8%
CHILD POVERTY UNDER THE AGE OF 16
22.0/ 100
METRIC RATING
196th/ 347
METRIC RANK
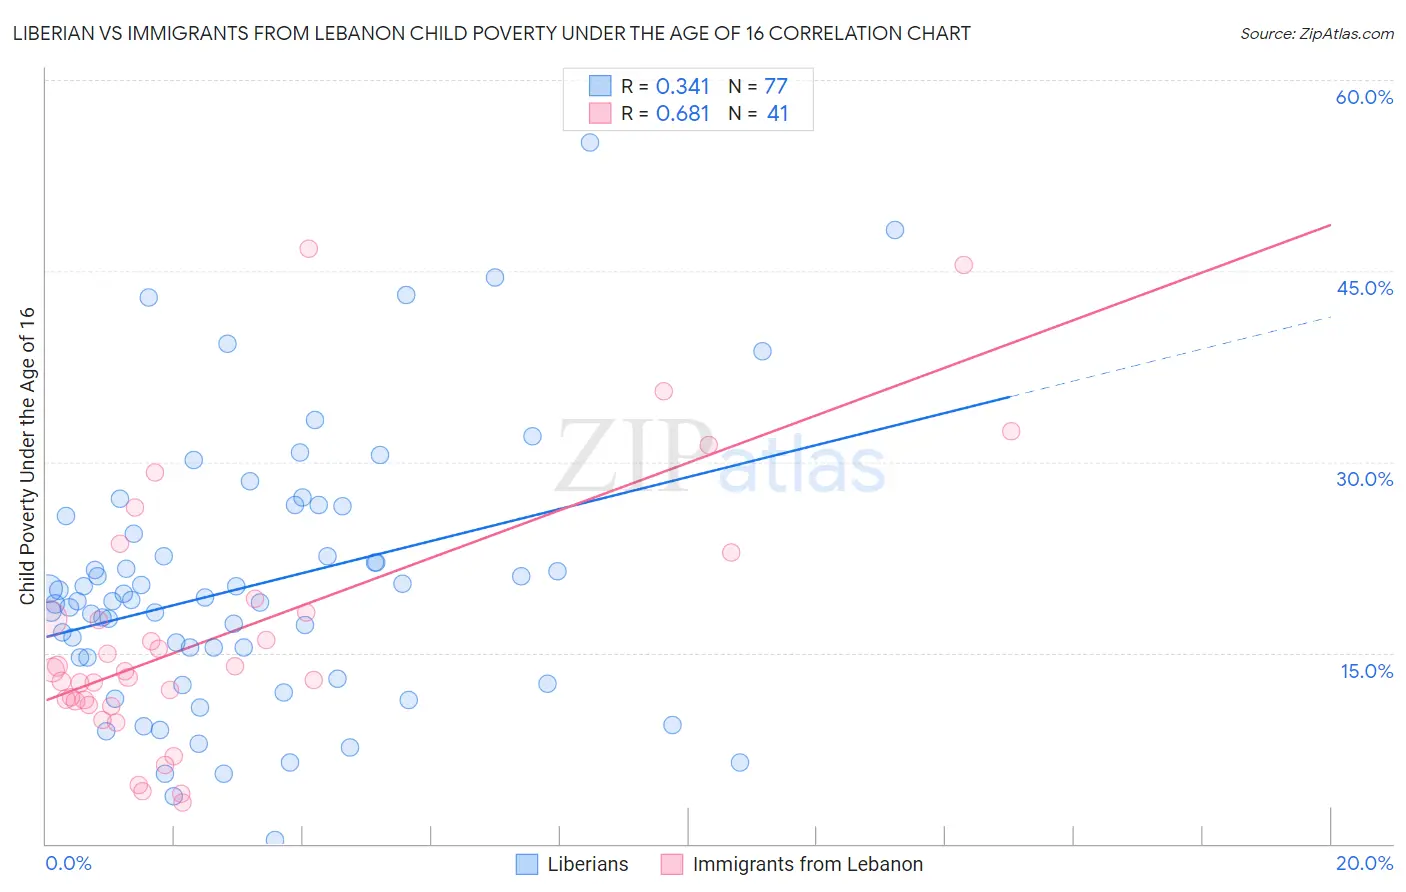
Liberian vs Immigrants from Lebanon Child Poverty Under the Age of 16 Correlation Chart
The statistical analysis conducted on geographies consisting of 117,874,935 people shows a mild positive correlation between the proportion of Liberians and poverty level among children under the age of 16 in the United States with a correlation coefficient (R) of 0.341 and weighted average of 19.5%. Similarly, the statistical analysis conducted on geographies consisting of 216,197,294 people shows a significant positive correlation between the proportion of Immigrants from Lebanon and poverty level among children under the age of 16 in the United States with a correlation coefficient (R) of 0.681 and weighted average of 16.8%, a difference of 15.9%.
Child Poverty Under the Age of 16 Correlation Summary
| Measurement | Liberian | Immigrants from Lebanon |
| Minimum | 0.33% | 3.3% |
| Maximum | 55.1% | 46.8% |
| Range | 54.8% | 43.5% |
| Mean | 20.3% | 16.5% |
| Median | 19.1% | 13.5% |
| Interquartile 25% (IQ1) | 13.8% | 11.0% |
| Interquartile 75% (IQ3) | 25.0% | 18.7% |
| Interquartile Range (IQR) | 11.2% | 7.7% |
| Standard Deviation (Sample) | 10.5% | 10.2% |
| Standard Deviation (Population) | 10.4% | 10.1% |
Similar Demographics by Child Poverty Under the Age of 16
Demographics Similar to Liberians by Child Poverty Under the Age of 16
In terms of child poverty under the age of 16, the demographic groups most similar to Liberians are Chickasaw (19.5%, a difference of 0.10%), Immigrants from Ecuador (19.4%, a difference of 0.22%), Vietnamese (19.4%, a difference of 0.28%), Cherokee (19.5%, a difference of 0.29%), and Immigrants from Guyana (19.4%, a difference of 0.60%).
| Demographics | Rating | Rank | Child Poverty Under the Age of 16 |
| Mexican American Indians | 0.2 /100 | #259 | Tragic 19.3% |
| Guyanese | 0.2 /100 | #260 | Tragic 19.3% |
| Immigrants | Burma/Myanmar | 0.1 /100 | #261 | Tragic 19.4% |
| Immigrants | Guyana | 0.1 /100 | #262 | Tragic 19.4% |
| Vietnamese | 0.1 /100 | #263 | Tragic 19.4% |
| Immigrants | Ecuador | 0.1 /100 | #264 | Tragic 19.4% |
| Chickasaw | 0.1 /100 | #265 | Tragic 19.5% |
| Liberians | 0.1 /100 | #266 | Tragic 19.5% |
| Cherokee | 0.1 /100 | #267 | Tragic 19.5% |
| Jamaicans | 0.1 /100 | #268 | Tragic 19.7% |
| Immigrants | El Salvador | 0.1 /100 | #269 | Tragic 19.7% |
| Spanish American Indians | 0.1 /100 | #270 | Tragic 19.7% |
| Immigrants | Liberia | 0.1 /100 | #271 | Tragic 19.7% |
| Immigrants | Bangladesh | 0.1 /100 | #272 | Tragic 19.8% |
| Immigrants | Jamaica | 0.1 /100 | #273 | Tragic 19.8% |
Demographics Similar to Immigrants from Lebanon by Child Poverty Under the Age of 16
In terms of child poverty under the age of 16, the demographic groups most similar to Immigrants from Lebanon are Immigrants from Uganda (16.8%, a difference of 0.080%), Immigrants from Uruguay (16.8%, a difference of 0.17%), Spaniard (16.8%, a difference of 0.19%), Spanish (16.7%, a difference of 0.39%), and Immigrants from Kenya (16.9%, a difference of 0.52%).
| Demographics | Rating | Rank | Child Poverty Under the Age of 16 |
| Immigrants | Portugal | 30.0 /100 | #189 | Fair 16.6% |
| Immigrants | Costa Rica | 29.6 /100 | #190 | Fair 16.6% |
| Immigrants | Iraq | 28.3 /100 | #191 | Fair 16.7% |
| Spanish | 24.5 /100 | #192 | Fair 16.7% |
| Spaniards | 23.2 /100 | #193 | Fair 16.8% |
| Immigrants | Uruguay | 23.1 /100 | #194 | Fair 16.8% |
| Immigrants | Uganda | 22.5 /100 | #195 | Fair 16.8% |
| Immigrants | Lebanon | 22.0 /100 | #196 | Fair 16.8% |
| Immigrants | Kenya | 19.1 /100 | #197 | Poor 16.9% |
| Delaware | 17.1 /100 | #198 | Poor 17.0% |
| Immigrants | Afghanistan | 15.1 /100 | #199 | Poor 17.0% |
| Immigrants | Cameroon | 14.7 /100 | #200 | Poor 17.1% |
| Immigrants | Uzbekistan | 14.7 /100 | #201 | Poor 17.1% |
| Ugandans | 14.3 /100 | #202 | Poor 17.1% |
| Immigrants | Sierra Leone | 14.2 /100 | #203 | Poor 17.1% |