Laotian vs Crow Child Poverty Under the Age of 16
COMPARE
Laotian
Crow
Child Poverty Under the Age of 16
Child Poverty Under the Age of 16 Comparison
Laotians
Crow
14.3%
CHILD POVERTY UNDER THE AGE OF 16
98.0/ 100
METRIC RATING
68th/ 347
METRIC RANK
26.0%
CHILD POVERTY UNDER THE AGE OF 16
0.0/ 100
METRIC RATING
339th/ 347
METRIC RANK
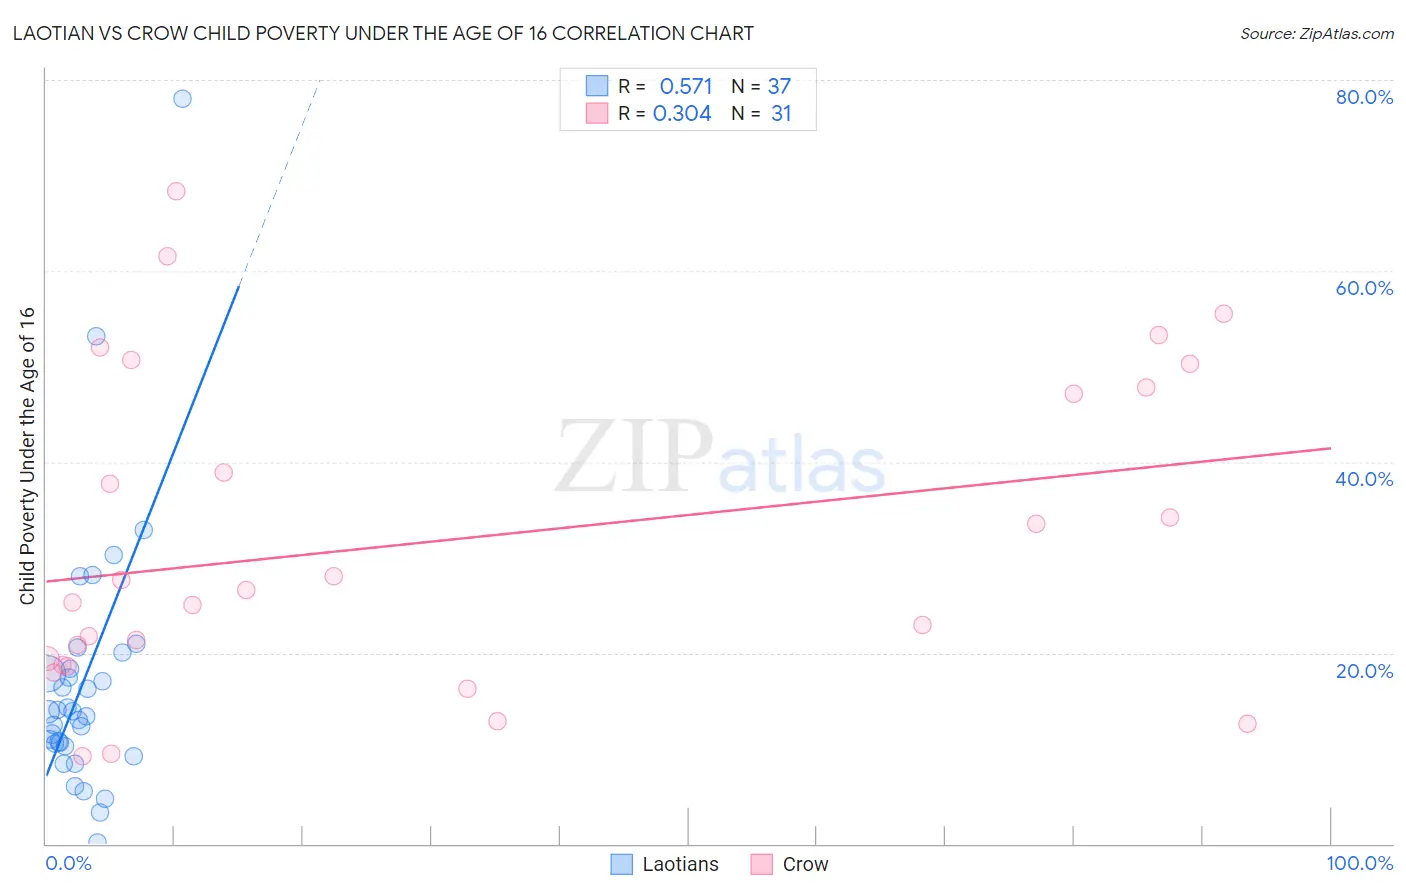
Laotian vs Crow Child Poverty Under the Age of 16 Correlation Chart
The statistical analysis conducted on geographies consisting of 223,849,875 people shows a substantial positive correlation between the proportion of Laotians and poverty level among children under the age of 16 in the United States with a correlation coefficient (R) of 0.571 and weighted average of 14.3%. Similarly, the statistical analysis conducted on geographies consisting of 59,147,618 people shows a mild positive correlation between the proportion of Crow and poverty level among children under the age of 16 in the United States with a correlation coefficient (R) of 0.304 and weighted average of 26.0%, a difference of 81.4%.
Child Poverty Under the Age of 16 Correlation Summary
| Measurement | Laotian | Crow |
| Minimum | 0.17% | 9.2% |
| Maximum | 78.1% | 68.3% |
| Range | 77.9% | 59.2% |
| Mean | 17.1% | 31.8% |
| Median | 13.8% | 26.6% |
| Interquartile 25% (IQ1) | 10.4% | 18.7% |
| Interquartile 75% (IQ3) | 19.1% | 47.8% |
| Interquartile Range (IQR) | 8.8% | 29.2% |
| Standard Deviation (Sample) | 14.1% | 16.5% |
| Standard Deviation (Population) | 13.9% | 16.2% |
Similar Demographics by Child Poverty Under the Age of 16
Demographics Similar to Laotians by Child Poverty Under the Age of 16
In terms of child poverty under the age of 16, the demographic groups most similar to Laotians are Immigrants from Bulgaria (14.3%, a difference of 0.080%), European (14.3%, a difference of 0.10%), Slovene (14.3%, a difference of 0.14%), Immigrants from Netherlands (14.3%, a difference of 0.18%), and Immigrants from Poland (14.3%, a difference of 0.18%).
| Demographics | Rating | Rank | Child Poverty Under the Age of 16 |
| Immigrants | Sweden | 98.5 /100 | #61 | Exceptional 14.2% |
| Zimbabweans | 98.5 /100 | #62 | Exceptional 14.2% |
| Immigrants | Europe | 98.4 /100 | #63 | Exceptional 14.2% |
| Immigrants | Romania | 98.3 /100 | #64 | Exceptional 14.2% |
| Immigrants | Philippines | 98.2 /100 | #65 | Exceptional 14.3% |
| Slovenes | 98.1 /100 | #66 | Exceptional 14.3% |
| Europeans | 98.1 /100 | #67 | Exceptional 14.3% |
| Laotians | 98.0 /100 | #68 | Exceptional 14.3% |
| Immigrants | Bulgaria | 98.0 /100 | #69 | Exceptional 14.3% |
| Immigrants | Netherlands | 97.9 /100 | #70 | Exceptional 14.3% |
| Immigrants | Poland | 97.9 /100 | #71 | Exceptional 14.3% |
| Cambodians | 97.8 /100 | #72 | Exceptional 14.4% |
| Immigrants | Turkey | 97.6 /100 | #73 | Exceptional 14.4% |
| Macedonians | 97.6 /100 | #74 | Exceptional 14.4% |
| Ukrainians | 97.5 /100 | #75 | Exceptional 14.4% |
Demographics Similar to Crow by Child Poverty Under the Age of 16
In terms of child poverty under the age of 16, the demographic groups most similar to Crow are Cheyenne (25.4%, a difference of 2.3%), Sioux (25.2%, a difference of 2.9%), Yup'ik (25.1%, a difference of 3.3%), Houma (24.9%, a difference of 4.4%), and Hopi (27.1%, a difference of 4.4%).
| Demographics | Rating | Rank | Child Poverty Under the Age of 16 |
| Pueblo | 0.0 /100 | #332 | Tragic 23.9% |
| Immigrants | Dominican Republic | 0.0 /100 | #333 | Tragic 24.0% |
| Blacks/African Americans | 0.0 /100 | #334 | Tragic 24.4% |
| Houma | 0.0 /100 | #335 | Tragic 24.9% |
| Yup'ik | 0.0 /100 | #336 | Tragic 25.1% |
| Sioux | 0.0 /100 | #337 | Tragic 25.2% |
| Cheyenne | 0.0 /100 | #338 | Tragic 25.4% |
| Crow | 0.0 /100 | #339 | Tragic 26.0% |
| Hopi | 0.0 /100 | #340 | Tragic 27.1% |
| Yuman | 0.0 /100 | #341 | Tragic 28.9% |
| Pima | 0.0 /100 | #342 | Tragic 29.0% |
| Immigrants | Yemen | 0.0 /100 | #343 | Tragic 29.1% |
| Navajo | 0.0 /100 | #344 | Tragic 30.2% |
| Lumbee | 0.0 /100 | #345 | Tragic 31.0% |
| Tohono O'odham | 0.0 /100 | #346 | Tragic 31.7% |