Kiowa vs Immigrants from Panama Unemployment Among Women with Children Under 18 years
COMPARE
Kiowa
Immigrants from Panama
Unemployment Among Women with Children Under 18 years
Unemployment Among Women with Children Under 18 years Comparison
Kiowa
Immigrants from Panama
6.3%
UNEMPLOYMENT AMONG WOMEN WITH CHILDREN UNDER 18 YEARS
0.0/ 100
METRIC RATING
287th/ 347
METRIC RANK
5.8%
UNEMPLOYMENT AMONG WOMEN WITH CHILDREN UNDER 18 YEARS
3.4/ 100
METRIC RATING
229th/ 347
METRIC RANK
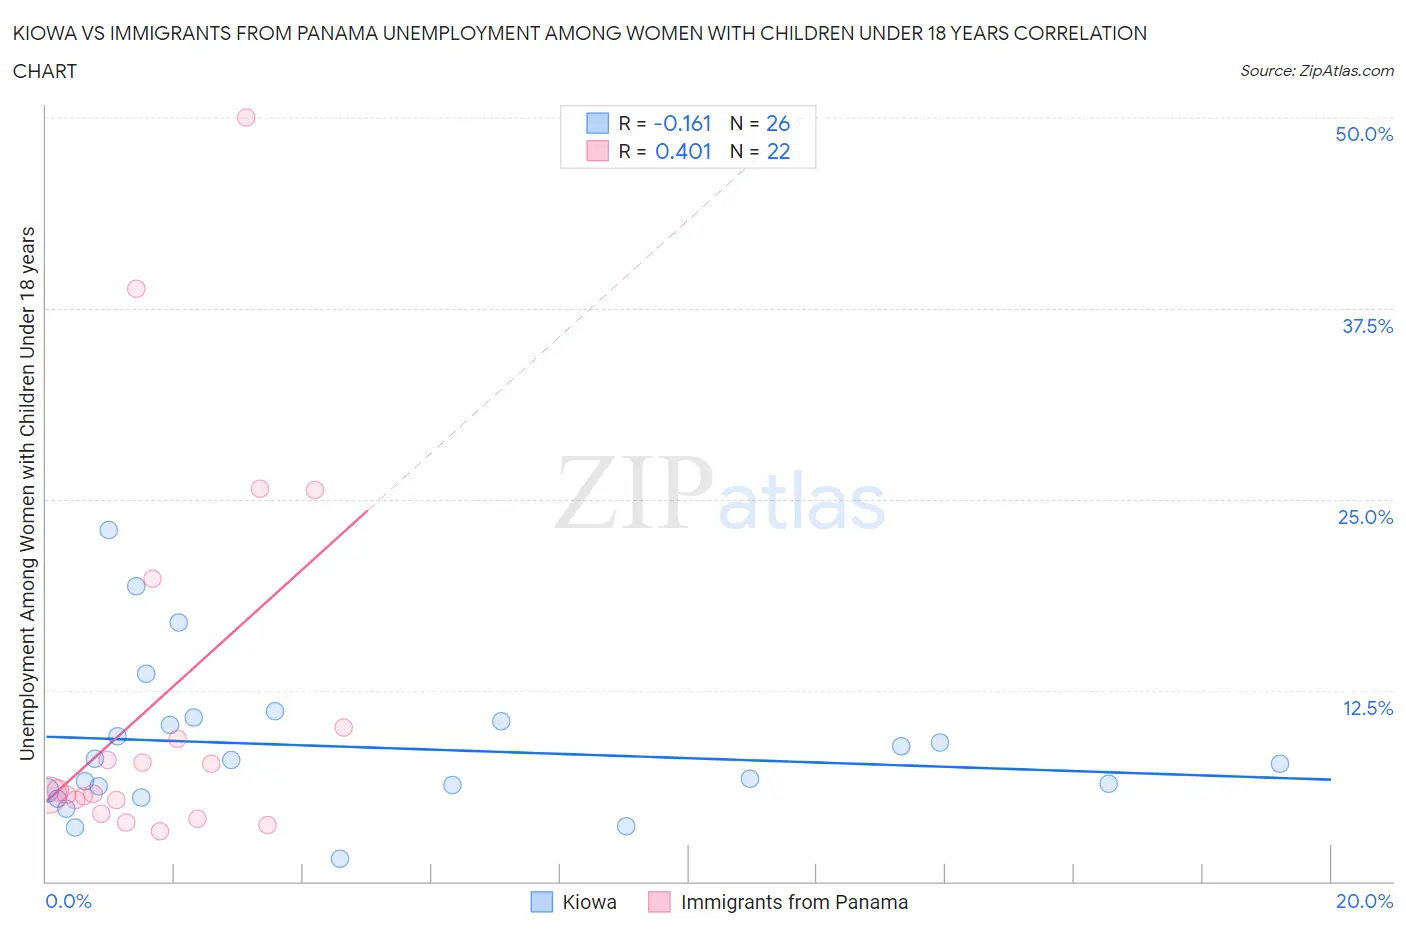
Kiowa vs Immigrants from Panama Unemployment Among Women with Children Under 18 years Correlation Chart
The statistical analysis conducted on geographies consisting of 55,431,596 people shows a poor negative correlation between the proportion of Kiowa and unemployment rate among women with children under the age of 18 in the United States with a correlation coefficient (R) of -0.161 and weighted average of 6.3%. Similarly, the statistical analysis conducted on geographies consisting of 217,722,882 people shows a moderate positive correlation between the proportion of Immigrants from Panama and unemployment rate among women with children under the age of 18 in the United States with a correlation coefficient (R) of 0.401 and weighted average of 5.8%, a difference of 9.7%.
Unemployment Among Women with Children Under 18 years Correlation Summary
| Measurement | Kiowa | Immigrants from Panama |
| Minimum | 1.5% | 3.3% |
| Maximum | 23.0% | 50.0% |
| Range | 21.5% | 46.7% |
| Mean | 8.8% | 11.9% |
| Median | 7.8% | 5.8% |
| Interquartile 25% (IQ1) | 5.9% | 5.3% |
| Interquartile 75% (IQ3) | 10.5% | 10.1% |
| Interquartile Range (IQR) | 4.6% | 4.8% |
| Standard Deviation (Sample) | 4.9% | 12.5% |
| Standard Deviation (Population) | 4.8% | 12.2% |
Similar Demographics by Unemployment Among Women with Children Under 18 years
Demographics Similar to Kiowa by Unemployment Among Women with Children Under 18 years
In terms of unemployment among women with children under 18 years, the demographic groups most similar to Kiowa are Alaskan Athabascan (6.3%, a difference of 0.010%), Cree (6.3%, a difference of 0.12%), Bahamian (6.3%, a difference of 0.16%), Immigrants from Grenada (6.3%, a difference of 0.31%), and West Indian (6.3%, a difference of 0.34%).
| Demographics | Rating | Rank | Unemployment Among Women with Children Under 18 years |
| Guatemalans | 0.0 /100 | #280 | Tragic 6.3% |
| Immigrants | El Salvador | 0.0 /100 | #281 | Tragic 6.3% |
| Immigrants | St. Vincent and the Grenadines | 0.0 /100 | #282 | Tragic 6.3% |
| West Indians | 0.0 /100 | #283 | Tragic 6.3% |
| Immigrants | Grenada | 0.0 /100 | #284 | Tragic 6.3% |
| Bahamians | 0.0 /100 | #285 | Tragic 6.3% |
| Alaskan Athabascans | 0.0 /100 | #286 | Tragic 6.3% |
| Kiowa | 0.0 /100 | #287 | Tragic 6.3% |
| Cree | 0.0 /100 | #288 | Tragic 6.3% |
| Immigrants | Caribbean | 0.0 /100 | #289 | Tragic 6.4% |
| Blackfeet | 0.0 /100 | #290 | Tragic 6.4% |
| Immigrants | Guatemala | 0.0 /100 | #291 | Tragic 6.4% |
| Mexicans | 0.0 /100 | #292 | Tragic 6.4% |
| Immigrants | Bangladesh | 0.0 /100 | #293 | Tragic 6.4% |
| Hondurans | 0.0 /100 | #294 | Tragic 6.4% |
Demographics Similar to Immigrants from Panama by Unemployment Among Women with Children Under 18 years
In terms of unemployment among women with children under 18 years, the demographic groups most similar to Immigrants from Panama are Immigrants from South America (5.8%, a difference of 0.060%), Somali (5.8%, a difference of 0.090%), Immigrants from Africa (5.8%, a difference of 0.12%), Creek (5.8%, a difference of 0.15%), and Spanish American (5.8%, a difference of 0.17%).
| Demographics | Rating | Rank | Unemployment Among Women with Children Under 18 years |
| Osage | 5.0 /100 | #222 | Tragic 5.7% |
| Potawatomi | 5.0 /100 | #223 | Tragic 5.7% |
| Immigrants | Syria | 4.6 /100 | #224 | Tragic 5.7% |
| Armenians | 4.5 /100 | #225 | Tragic 5.7% |
| Cherokee | 4.3 /100 | #226 | Tragic 5.7% |
| Sierra Leoneans | 3.8 /100 | #227 | Tragic 5.8% |
| Somalis | 3.5 /100 | #228 | Tragic 5.8% |
| Immigrants | Panama | 3.4 /100 | #229 | Tragic 5.8% |
| Immigrants | South America | 3.2 /100 | #230 | Tragic 5.8% |
| Immigrants | Africa | 3.1 /100 | #231 | Tragic 5.8% |
| Creek | 3.1 /100 | #232 | Tragic 5.8% |
| Spanish Americans | 3.1 /100 | #233 | Tragic 5.8% |
| Guamanians/Chamorros | 2.9 /100 | #234 | Tragic 5.8% |
| Immigrants | Middle Africa | 2.8 /100 | #235 | Tragic 5.8% |
| Alsatians | 2.5 /100 | #236 | Tragic 5.8% |