Kenyan vs Immigrants from Canada Female Poverty Among 25-34 Year Olds
COMPARE
Kenyan
Immigrants from Canada
Female Poverty Among 25-34 Year Olds
Female Poverty Among 25-34 Year Olds Comparison
Kenyans
Immigrants from Canada
13.5%
FEMALE POVERTY AMONG 25-34 YEAR OLDS
51.8/ 100
METRIC RATING
173rd/ 347
METRIC RANK
12.9%
FEMALE POVERTY AMONG 25-34 YEAR OLDS
91.5/ 100
METRIC RATING
125th/ 347
METRIC RANK
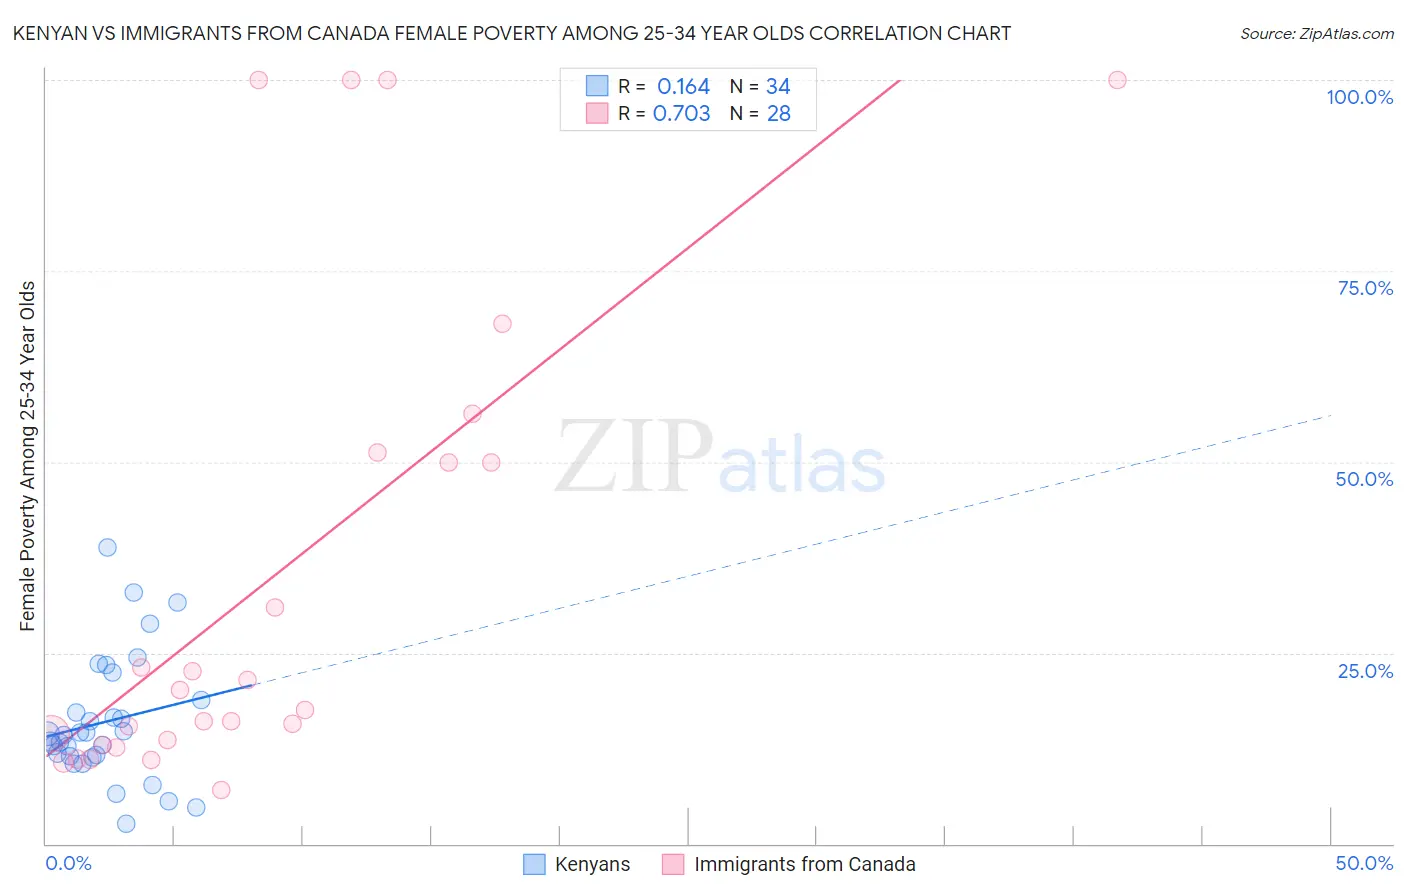
Kenyan vs Immigrants from Canada Female Poverty Among 25-34 Year Olds Correlation Chart
The statistical analysis conducted on geographies consisting of 167,556,876 people shows a poor positive correlation between the proportion of Kenyans and poverty level among females between the ages 25 and 34 in the United States with a correlation coefficient (R) of 0.164 and weighted average of 13.5%. Similarly, the statistical analysis conducted on geographies consisting of 448,185,141 people shows a strong positive correlation between the proportion of Immigrants from Canada and poverty level among females between the ages 25 and 34 in the United States with a correlation coefficient (R) of 0.703 and weighted average of 12.9%, a difference of 5.0%.
Female Poverty Among 25-34 Year Olds Correlation Summary
| Measurement | Kenyan | Immigrants from Canada |
| Minimum | 2.6% | 7.1% |
| Maximum | 38.8% | 100.0% |
| Range | 36.2% | 92.9% |
| Mean | 16.0% | 35.0% |
| Median | 14.3% | 18.8% |
| Interquartile 25% (IQ1) | 11.4% | 13.3% |
| Interquartile 75% (IQ3) | 18.8% | 50.6% |
| Interquartile Range (IQR) | 7.3% | 37.3% |
| Standard Deviation (Sample) | 8.2% | 31.4% |
| Standard Deviation (Population) | 8.1% | 30.8% |
Similar Demographics by Female Poverty Among 25-34 Year Olds
Demographics Similar to Kenyans by Female Poverty Among 25-34 Year Olds
In terms of female poverty among 25-34 year olds, the demographic groups most similar to Kenyans are South American Indian (13.5%, a difference of 0.010%), Immigrants from Costa Rica (13.5%, a difference of 0.010%), Immigrants from Uganda (13.5%, a difference of 0.10%), Immigrants from Oceania (13.5%, a difference of 0.15%), and Bermudan (13.6%, a difference of 0.41%).
| Demographics | Rating | Rank | Female Poverty Among 25-34 Year Olds |
| Belgians | 58.9 /100 | #166 | Average 13.4% |
| Immigrants | Bosnia and Herzegovina | 58.6 /100 | #167 | Average 13.4% |
| Immigrants | Afghanistan | 57.7 /100 | #168 | Average 13.4% |
| Samoans | 56.8 /100 | #169 | Average 13.5% |
| Immigrants | Uganda | 53.0 /100 | #170 | Average 13.5% |
| South American Indians | 51.9 /100 | #171 | Average 13.5% |
| Immigrants | Costa Rica | 51.9 /100 | #172 | Average 13.5% |
| Kenyans | 51.8 /100 | #173 | Average 13.5% |
| Immigrants | Oceania | 50.0 /100 | #174 | Average 13.5% |
| Bermudans | 46.8 /100 | #175 | Average 13.6% |
| Yugoslavians | 45.0 /100 | #176 | Average 13.6% |
| Venezuelans | 44.6 /100 | #177 | Average 13.6% |
| Canadians | 44.3 /100 | #178 | Average 13.6% |
| Immigrants | Eastern Africa | 43.6 /100 | #179 | Average 13.6% |
| Germans | 41.6 /100 | #180 | Average 13.6% |
Demographics Similar to Immigrants from Canada by Female Poverty Among 25-34 Year Olds
In terms of female poverty among 25-34 year olds, the demographic groups most similar to Immigrants from Canada are Immigrants from Fiji (12.9%, a difference of 0.080%), Immigrants from Netherlands (12.8%, a difference of 0.15%), Czech (12.9%, a difference of 0.32%), Syrian (12.9%, a difference of 0.33%), and Slovene (12.8%, a difference of 0.37%).
| Demographics | Rating | Rank | Female Poverty Among 25-34 Year Olds |
| Mongolians | 93.0 /100 | #118 | Exceptional 12.8% |
| Immigrants | Nepal | 93.0 /100 | #119 | Exceptional 12.8% |
| Carpatho Rusyns | 93.0 /100 | #120 | Exceptional 12.8% |
| Romanians | 92.8 /100 | #121 | Exceptional 12.8% |
| Immigrants | Western Asia | 92.7 /100 | #122 | Exceptional 12.8% |
| Slovenes | 92.7 /100 | #123 | Exceptional 12.8% |
| Immigrants | Netherlands | 92.0 /100 | #124 | Exceptional 12.8% |
| Immigrants | Canada | 91.5 /100 | #125 | Exceptional 12.9% |
| Immigrants | Fiji | 91.2 /100 | #126 | Exceptional 12.9% |
| Czechs | 90.3 /100 | #127 | Exceptional 12.9% |
| Syrians | 90.2 /100 | #128 | Exceptional 12.9% |
| Immigrants | North America | 89.7 /100 | #129 | Excellent 12.9% |
| Immigrants | Uzbekistan | 89.6 /100 | #130 | Excellent 12.9% |
| Pakistanis | 88.4 /100 | #131 | Excellent 13.0% |
| Immigrants | Hungary | 88.3 /100 | #132 | Excellent 13.0% |