Swedish vs Immigrants from Canada Female Poverty Among 25-34 Year Olds
COMPARE
Swedish
Immigrants from Canada
Female Poverty Among 25-34 Year Olds
Female Poverty Among 25-34 Year Olds Comparison
Swedes
Immigrants from Canada
12.7%
FEMALE POVERTY AMONG 25-34 YEAR OLDS
95.4/ 100
METRIC RATING
104th/ 347
METRIC RANK
12.9%
FEMALE POVERTY AMONG 25-34 YEAR OLDS
91.5/ 100
METRIC RATING
125th/ 347
METRIC RANK
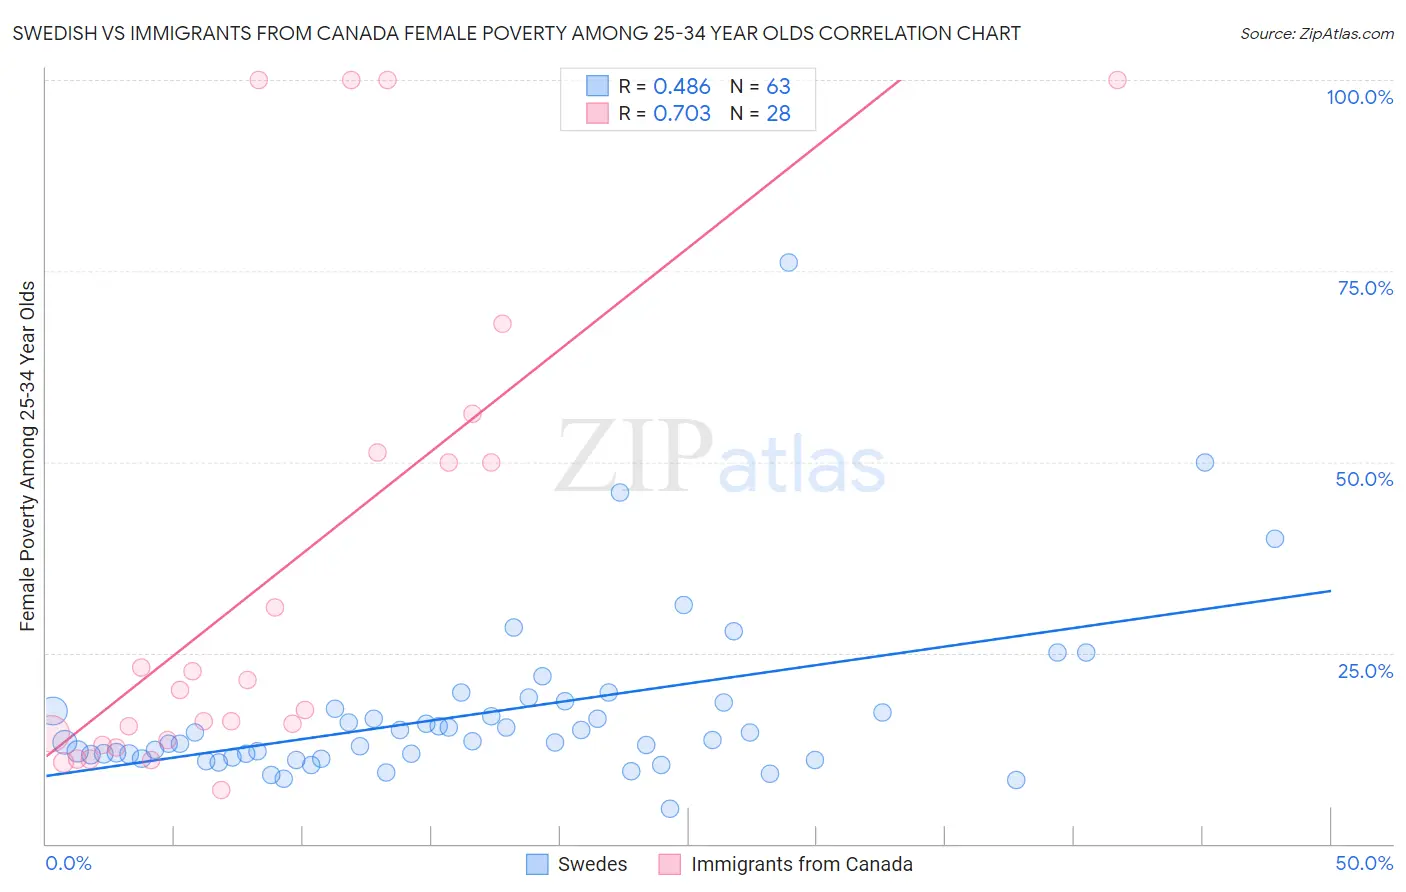
Swedish vs Immigrants from Canada Female Poverty Among 25-34 Year Olds Correlation Chart
The statistical analysis conducted on geographies consisting of 520,171,676 people shows a moderate positive correlation between the proportion of Swedes and poverty level among females between the ages 25 and 34 in the United States with a correlation coefficient (R) of 0.486 and weighted average of 12.7%. Similarly, the statistical analysis conducted on geographies consisting of 448,185,141 people shows a strong positive correlation between the proportion of Immigrants from Canada and poverty level among females between the ages 25 and 34 in the United States with a correlation coefficient (R) of 0.703 and weighted average of 12.9%, a difference of 1.4%.
Female Poverty Among 25-34 Year Olds Correlation Summary
| Measurement | Swedish | Immigrants from Canada |
| Minimum | 4.6% | 7.1% |
| Maximum | 76.1% | 100.0% |
| Range | 71.5% | 92.9% |
| Mean | 17.0% | 35.0% |
| Median | 13.4% | 18.8% |
| Interquartile 25% (IQ1) | 11.3% | 13.3% |
| Interquartile 75% (IQ3) | 17.7% | 50.6% |
| Interquartile Range (IQR) | 6.3% | 37.3% |
| Standard Deviation (Sample) | 11.3% | 31.4% |
| Standard Deviation (Population) | 11.2% | 30.8% |
Similar Demographics by Female Poverty Among 25-34 Year Olds
Demographics Similar to Swedes by Female Poverty Among 25-34 Year Olds
In terms of female poverty among 25-34 year olds, the demographic groups most similar to Swedes are Immigrants from Spain (12.7%, a difference of 0.050%), Immigrants from South Africa (12.7%, a difference of 0.050%), Peruvian (12.7%, a difference of 0.11%), Tsimshian (12.7%, a difference of 0.15%), and Immigrants from Switzerland (12.7%, a difference of 0.17%).
| Demographics | Rating | Rank | Female Poverty Among 25-34 Year Olds |
| Immigrants | Northern Africa | 96.6 /100 | #97 | Exceptional 12.6% |
| Immigrants | Ethiopia | 96.5 /100 | #98 | Exceptional 12.6% |
| Immigrants | Argentina | 96.4 /100 | #99 | Exceptional 12.6% |
| Immigrants | Denmark | 95.7 /100 | #100 | Exceptional 12.7% |
| Immigrants | Switzerland | 95.7 /100 | #101 | Exceptional 12.7% |
| Peruvians | 95.6 /100 | #102 | Exceptional 12.7% |
| Immigrants | Spain | 95.5 /100 | #103 | Exceptional 12.7% |
| Swedes | 95.4 /100 | #104 | Exceptional 12.7% |
| Immigrants | South Africa | 95.3 /100 | #105 | Exceptional 12.7% |
| Tsimshian | 95.1 /100 | #106 | Exceptional 12.7% |
| Poles | 94.9 /100 | #107 | Exceptional 12.7% |
| Immigrants | Norway | 94.4 /100 | #108 | Exceptional 12.7% |
| Immigrants | Peru | 94.3 /100 | #109 | Exceptional 12.7% |
| Australians | 94.1 /100 | #110 | Exceptional 12.8% |
| Danes | 93.9 /100 | #111 | Exceptional 12.8% |
Demographics Similar to Immigrants from Canada by Female Poverty Among 25-34 Year Olds
In terms of female poverty among 25-34 year olds, the demographic groups most similar to Immigrants from Canada are Immigrants from Fiji (12.9%, a difference of 0.080%), Immigrants from Netherlands (12.8%, a difference of 0.15%), Czech (12.9%, a difference of 0.32%), Syrian (12.9%, a difference of 0.33%), and Slovene (12.8%, a difference of 0.37%).
| Demographics | Rating | Rank | Female Poverty Among 25-34 Year Olds |
| Mongolians | 93.0 /100 | #118 | Exceptional 12.8% |
| Immigrants | Nepal | 93.0 /100 | #119 | Exceptional 12.8% |
| Carpatho Rusyns | 93.0 /100 | #120 | Exceptional 12.8% |
| Romanians | 92.8 /100 | #121 | Exceptional 12.8% |
| Immigrants | Western Asia | 92.7 /100 | #122 | Exceptional 12.8% |
| Slovenes | 92.7 /100 | #123 | Exceptional 12.8% |
| Immigrants | Netherlands | 92.0 /100 | #124 | Exceptional 12.8% |
| Immigrants | Canada | 91.5 /100 | #125 | Exceptional 12.9% |
| Immigrants | Fiji | 91.2 /100 | #126 | Exceptional 12.9% |
| Czechs | 90.3 /100 | #127 | Exceptional 12.9% |
| Syrians | 90.2 /100 | #128 | Exceptional 12.9% |
| Immigrants | North America | 89.7 /100 | #129 | Excellent 12.9% |
| Immigrants | Uzbekistan | 89.6 /100 | #130 | Excellent 12.9% |
| Pakistanis | 88.4 /100 | #131 | Excellent 13.0% |
| Immigrants | Hungary | 88.3 /100 | #132 | Excellent 13.0% |