Immigrants from St. Vincent and the Grenadines vs Immigrants from Bahamas Female Poverty Among 25-34 Year Olds
COMPARE
Immigrants from St. Vincent and the Grenadines
Immigrants from Bahamas
Female Poverty Among 25-34 Year Olds
Female Poverty Among 25-34 Year Olds Comparison
Immigrants from St. Vincent and the Grenadines
Immigrants from Bahamas
13.8%
FEMALE POVERTY AMONG 25-34 YEAR OLDS
29.3/ 100
METRIC RATING
191st/ 347
METRIC RANK
16.3%
FEMALE POVERTY AMONG 25-34 YEAR OLDS
0.0/ 100
METRIC RATING
285th/ 347
METRIC RANK
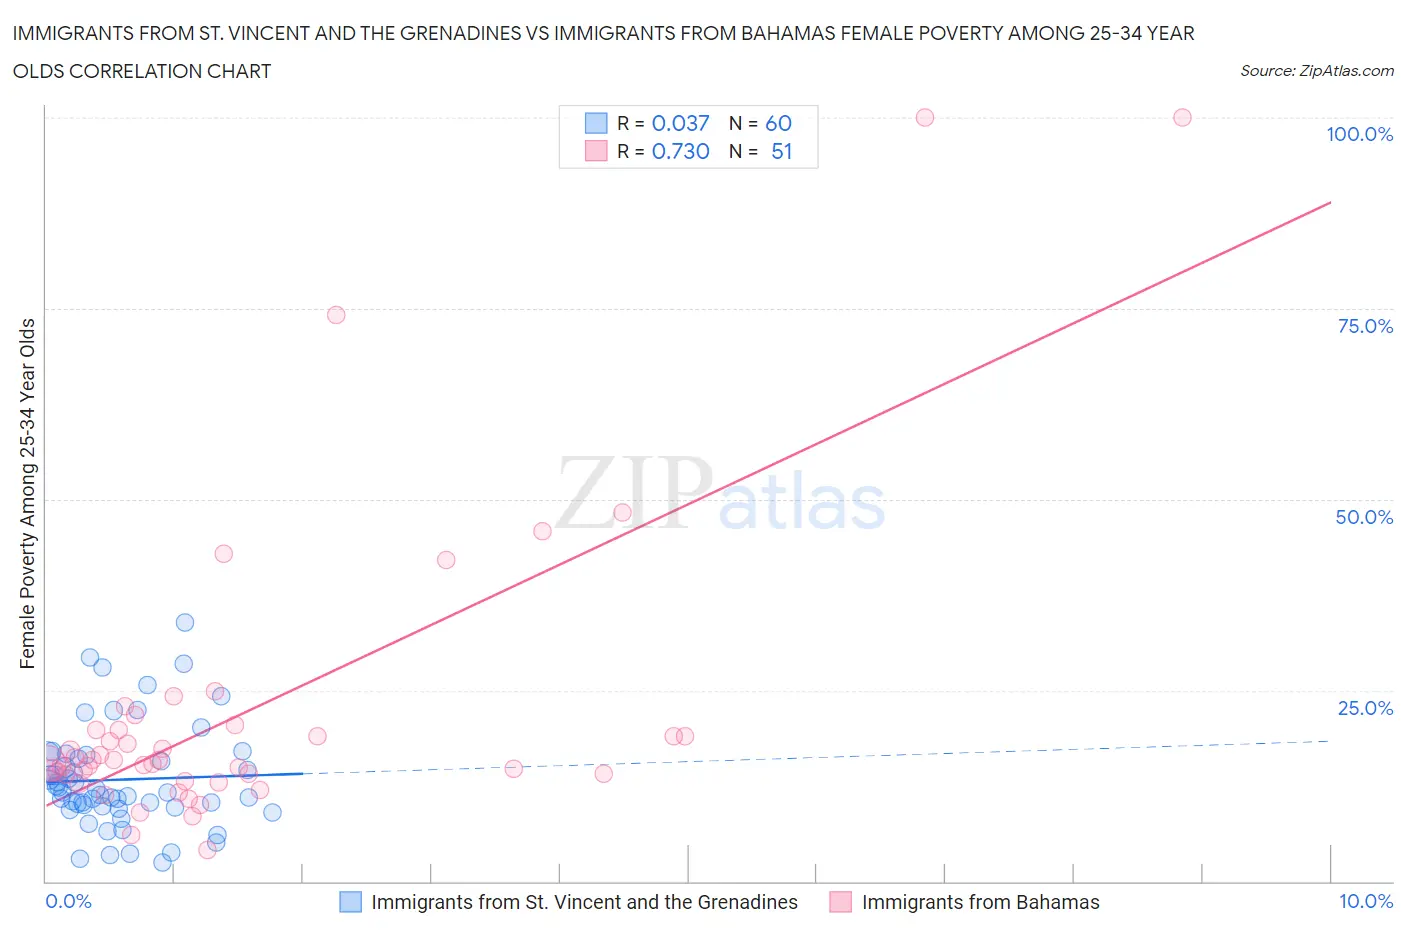
Immigrants from St. Vincent and the Grenadines vs Immigrants from Bahamas Female Poverty Among 25-34 Year Olds Correlation Chart
The statistical analysis conducted on geographies consisting of 55,954,264 people shows no correlation between the proportion of Immigrants from St. Vincent and the Grenadines and poverty level among females between the ages 25 and 34 in the United States with a correlation coefficient (R) of 0.037 and weighted average of 13.8%. Similarly, the statistical analysis conducted on geographies consisting of 104,297,091 people shows a strong positive correlation between the proportion of Immigrants from Bahamas and poverty level among females between the ages 25 and 34 in the United States with a correlation coefficient (R) of 0.730 and weighted average of 16.3%, a difference of 18.4%.
Female Poverty Among 25-34 Year Olds Correlation Summary
| Measurement | Immigrants from St. Vincent and the Grenadines | Immigrants from Bahamas |
| Minimum | 2.4% | 4.0% |
| Maximum | 33.8% | 100.0% |
| Range | 31.4% | 96.0% |
| Mean | 13.3% | 22.1% |
| Median | 11.6% | 15.8% |
| Interquartile 25% (IQ1) | 9.8% | 13.9% |
| Interquartile 75% (IQ3) | 16.3% | 19.9% |
| Interquartile Range (IQR) | 6.6% | 5.9% |
| Standard Deviation (Sample) | 6.8% | 19.9% |
| Standard Deviation (Population) | 6.7% | 19.7% |
Similar Demographics by Female Poverty Among 25-34 Year Olds
Demographics Similar to Immigrants from St. Vincent and the Grenadines by Female Poverty Among 25-34 Year Olds
In terms of female poverty among 25-34 year olds, the demographic groups most similar to Immigrants from St. Vincent and the Grenadines are Dutch (13.8%, a difference of 0.040%), Tlingit-Haida (13.8%, a difference of 0.12%), Immigrants from Kenya (13.8%, a difference of 0.14%), Finnish (13.7%, a difference of 0.30%), and Immigrants from Eritrea (13.7%, a difference of 0.32%).
| Demographics | Rating | Rank | Female Poverty Among 25-34 Year Olds |
| Czechoslovakians | 36.8 /100 | #184 | Fair 13.7% |
| Irish | 35.3 /100 | #185 | Fair 13.7% |
| Immigrants | Uruguay | 34.1 /100 | #186 | Fair 13.7% |
| Slovaks | 34.1 /100 | #187 | Fair 13.7% |
| Immigrants | Eritrea | 32.7 /100 | #188 | Fair 13.7% |
| Finns | 32.5 /100 | #189 | Fair 13.7% |
| Dutch | 29.7 /100 | #190 | Fair 13.8% |
| Immigrants | St. Vincent and the Grenadines | 29.3 /100 | #191 | Fair 13.8% |
| Tlingit-Haida | 28.1 /100 | #192 | Fair 13.8% |
| Immigrants | Kenya | 28.0 /100 | #193 | Fair 13.8% |
| Moroccans | 25.1 /100 | #194 | Fair 13.8% |
| Immigrants | Cambodia | 24.0 /100 | #195 | Fair 13.9% |
| Scottish | 23.6 /100 | #196 | Fair 13.9% |
| Immigrants | Saudi Arabia | 21.9 /100 | #197 | Fair 13.9% |
| Immigrants | Germany | 20.9 /100 | #198 | Fair 13.9% |
Demographics Similar to Immigrants from Bahamas by Female Poverty Among 25-34 Year Olds
In terms of female poverty among 25-34 year olds, the demographic groups most similar to Immigrants from Bahamas are Cape Verdean (16.3%, a difference of 0.18%), American (16.4%, a difference of 0.23%), Guatemalan (16.4%, a difference of 0.42%), Osage (16.4%, a difference of 0.48%), and Shoshone (16.2%, a difference of 0.50%).
| Demographics | Rating | Rank | Female Poverty Among 25-34 Year Olds |
| French American Indians | 0.0 /100 | #278 | Tragic 15.9% |
| Fijians | 0.0 /100 | #279 | Tragic 15.9% |
| Bangladeshis | 0.0 /100 | #280 | Tragic 15.9% |
| Immigrants | Latin America | 0.0 /100 | #281 | Tragic 16.0% |
| Aleuts | 0.0 /100 | #282 | Tragic 16.1% |
| Bahamians | 0.0 /100 | #283 | Tragic 16.1% |
| Shoshone | 0.0 /100 | #284 | Tragic 16.2% |
| Immigrants | Bahamas | 0.0 /100 | #285 | Tragic 16.3% |
| Cape Verdeans | 0.0 /100 | #286 | Tragic 16.3% |
| Americans | 0.0 /100 | #287 | Tragic 16.4% |
| Guatemalans | 0.0 /100 | #288 | Tragic 16.4% |
| Osage | 0.0 /100 | #289 | Tragic 16.4% |
| Indonesians | 0.0 /100 | #290 | Tragic 16.4% |
| Comanche | 0.0 /100 | #291 | Tragic 16.5% |
| Immigrants | Dominica | 0.0 /100 | #292 | Tragic 16.5% |