Japanese vs Bolivian Householder Income Ages 45 - 64 years
COMPARE
Japanese
Bolivian
Householder Income Ages 45 - 64 years
Householder Income Ages 45 - 64 years Comparison
Japanese
Bolivians
$96,834
HOUSEHOLDER INCOME AGES 45 - 64 YEARS
14.8/ 100
METRIC RATING
209th/ 347
METRIC RANK
$118,871
HOUSEHOLDER INCOME AGES 45 - 64 YEARS
100.0/ 100
METRIC RATING
23rd/ 347
METRIC RANK
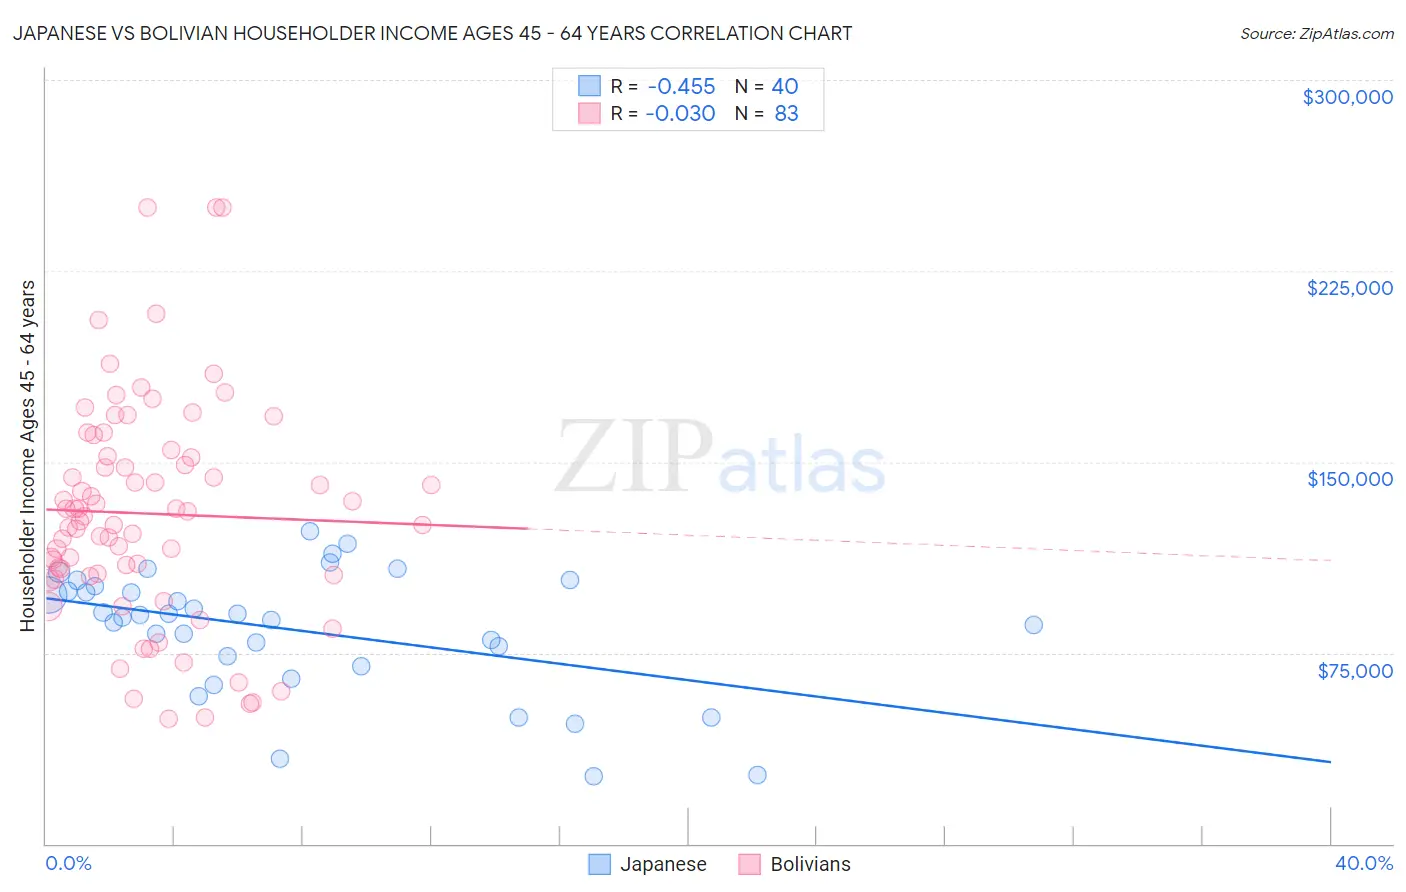
Japanese vs Bolivian Householder Income Ages 45 - 64 years Correlation Chart
The statistical analysis conducted on geographies consisting of 248,892,889 people shows a moderate negative correlation between the proportion of Japanese and household income with householder between the ages 45 and 64 in the United States with a correlation coefficient (R) of -0.455 and weighted average of $96,834. Similarly, the statistical analysis conducted on geographies consisting of 184,583,472 people shows no correlation between the proportion of Bolivians and household income with householder between the ages 45 and 64 in the United States with a correlation coefficient (R) of -0.030 and weighted average of $118,871, a difference of 22.8%.
Householder Income Ages 45 - 64 years Correlation Summary
| Measurement | Japanese | Bolivian |
| Minimum | $26,741 | $49,123 |
| Maximum | $122,806 | $250,001 |
| Range | $96,065 | $200,878 |
| Mean | $83,850 | $129,661 |
| Median | $89,335 | $128,631 |
| Interquartile 25% (IQ1) | $71,693 | $105,688 |
| Interquartile 75% (IQ3) | $100,167 | $152,268 |
| Interquartile Range (IQR) | $28,474 | $46,580 |
| Standard Deviation (Sample) | $24,280 | $43,264 |
| Standard Deviation (Population) | $23,975 | $43,003 |
Similar Demographics by Householder Income Ages 45 - 64 years
Demographics Similar to Japanese by Householder Income Ages 45 - 64 years
In terms of householder income ages 45 - 64 years, the demographic groups most similar to Japanese are Tsimshian ($96,783, a difference of 0.050%), Scotch-Irish ($97,073, a difference of 0.25%), Immigrants from Cambodia ($96,537, a difference of 0.31%), Venezuelan ($96,460, a difference of 0.39%), and Immigrants from Africa ($97,284, a difference of 0.46%).
| Demographics | Rating | Rank | Householder Income Ages 45 - 64 years |
| Tlingit-Haida | 18.9 /100 | #202 | Poor $97,417 |
| Immigrants | Thailand | 18.8 /100 | #203 | Poor $97,400 |
| Immigrants | Eritrea | 18.6 /100 | #204 | Poor $97,373 |
| Immigrants | Colombia | 18.0 /100 | #205 | Poor $97,290 |
| Immigrants | Africa | 17.9 /100 | #206 | Poor $97,284 |
| Ghanaians | 17.9 /100 | #207 | Poor $97,277 |
| Scotch-Irish | 16.4 /100 | #208 | Poor $97,073 |
| Japanese | 14.8 /100 | #209 | Poor $96,834 |
| Tsimshian | 14.5 /100 | #210 | Poor $96,783 |
| Immigrants | Cambodia | 13.0 /100 | #211 | Poor $96,537 |
| Venezuelans | 12.6 /100 | #212 | Poor $96,460 |
| Immigrants | Uruguay | 10.7 /100 | #213 | Poor $96,086 |
| Panamanians | 10.6 /100 | #214 | Poor $96,066 |
| Nigerians | 8.2 /100 | #215 | Tragic $95,492 |
| Immigrants | Venezuela | 7.6 /100 | #216 | Tragic $95,342 |
Demographics Similar to Bolivians by Householder Income Ages 45 - 64 years
In terms of householder income ages 45 - 64 years, the demographic groups most similar to Bolivians are Immigrants from Belgium ($118,932, a difference of 0.050%), Immigrants from Sri Lanka ($119,094, a difference of 0.19%), Immigrants from Japan ($118,498, a difference of 0.32%), Immigrants from Australia ($119,308, a difference of 0.37%), and Asian ($118,426, a difference of 0.38%).
| Demographics | Rating | Rank | Householder Income Ages 45 - 64 years |
| Immigrants | China | 100.0 /100 | #16 | Exceptional $122,178 |
| Burmese | 100.0 /100 | #17 | Exceptional $121,444 |
| Immigrants | Korea | 100.0 /100 | #18 | Exceptional $121,243 |
| Eastern Europeans | 100.0 /100 | #19 | Exceptional $120,684 |
| Immigrants | Australia | 100.0 /100 | #20 | Exceptional $119,308 |
| Immigrants | Sri Lanka | 100.0 /100 | #21 | Exceptional $119,094 |
| Immigrants | Belgium | 100.0 /100 | #22 | Exceptional $118,932 |
| Bolivians | 100.0 /100 | #23 | Exceptional $118,871 |
| Immigrants | Japan | 100.0 /100 | #24 | Exceptional $118,498 |
| Asians | 100.0 /100 | #25 | Exceptional $118,426 |
| Immigrants | Sweden | 100.0 /100 | #26 | Exceptional $118,318 |
| Immigrants | Northern Europe | 100.0 /100 | #27 | Exceptional $117,930 |
| Turks | 100.0 /100 | #28 | Exceptional $117,814 |
| Bhutanese | 100.0 /100 | #29 | Exceptional $117,750 |
| Immigrants | Bolivia | 100.0 /100 | #30 | Exceptional $117,731 |