Immigrants from Bulgaria vs Immigrants from Venezuela Single Father Poverty
COMPARE
Immigrants from Bulgaria
Immigrants from Venezuela
Single Father Poverty
Single Father Poverty Comparison
Immigrants from Bulgaria
Immigrants from Venezuela
15.0%
SINGLE FATHER POVERTY
99.9/ 100
METRIC RATING
55th/ 347
METRIC RANK
16.4%
SINGLE FATHER POVERTY
31.0/ 100
METRIC RATING
186th/ 347
METRIC RANK
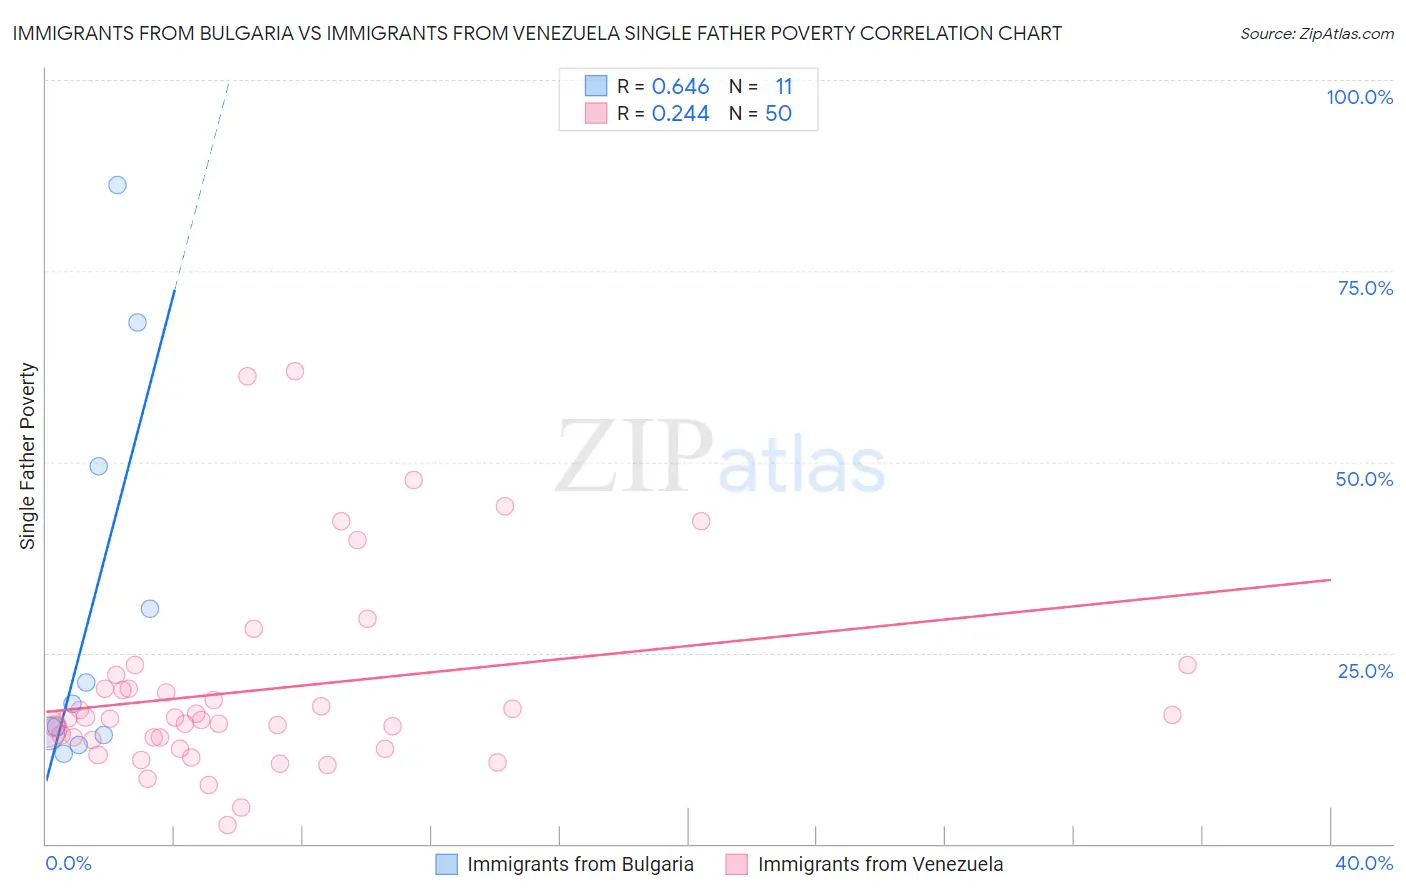
Immigrants from Bulgaria vs Immigrants from Venezuela Single Father Poverty Correlation Chart
The statistical analysis conducted on geographies consisting of 145,942,181 people shows a significant positive correlation between the proportion of Immigrants from Bulgaria and poverty level among single fathers in the United States with a correlation coefficient (R) of 0.646 and weighted average of 15.0%. Similarly, the statistical analysis conducted on geographies consisting of 236,867,266 people shows a weak positive correlation between the proportion of Immigrants from Venezuela and poverty level among single fathers in the United States with a correlation coefficient (R) of 0.244 and weighted average of 16.4%, a difference of 9.5%.
Single Father Poverty Correlation Summary
| Measurement | Immigrants from Bulgaria | Immigrants from Venezuela |
| Minimum | 11.8% | 2.4% |
| Maximum | 86.2% | 61.9% |
| Range | 74.4% | 59.5% |
| Mean | 31.2% | 20.2% |
| Median | 18.3% | 16.4% |
| Interquartile 25% (IQ1) | 14.3% | 13.6% |
| Interquartile 75% (IQ3) | 49.4% | 20.3% |
| Interquartile Range (IQR) | 35.1% | 6.7% |
| Standard Deviation (Sample) | 25.5% | 12.9% |
| Standard Deviation (Population) | 24.4% | 12.8% |
Similar Demographics by Single Father Poverty
Demographics Similar to Immigrants from Bulgaria by Single Father Poverty
In terms of single father poverty, the demographic groups most similar to Immigrants from Bulgaria are Immigrants from Uzbekistan (15.0%, a difference of 0.050%), Immigrants from Kenya (15.0%, a difference of 0.23%), Immigrants from El Salvador (15.0%, a difference of 0.26%), Immigrants from Laos (15.1%, a difference of 0.28%), and Immigrants from Pakistan (15.0%, a difference of 0.30%).
| Demographics | Rating | Rank | Single Father Poverty |
| Malaysians | 99.9 /100 | #48 | Exceptional 14.9% |
| Immigrants | Eastern Asia | 99.9 /100 | #49 | Exceptional 15.0% |
| Bhutanese | 99.9 /100 | #50 | Exceptional 15.0% |
| Immigrants | Pakistan | 99.9 /100 | #51 | Exceptional 15.0% |
| Immigrants | El Salvador | 99.9 /100 | #52 | Exceptional 15.0% |
| Immigrants | Kenya | 99.9 /100 | #53 | Exceptional 15.0% |
| Immigrants | Uzbekistan | 99.9 /100 | #54 | Exceptional 15.0% |
| Immigrants | Bulgaria | 99.9 /100 | #55 | Exceptional 15.0% |
| Immigrants | Laos | 99.9 /100 | #56 | Exceptional 15.1% |
| Laotians | 99.9 /100 | #57 | Exceptional 15.1% |
| Hawaiians | 99.9 /100 | #58 | Exceptional 15.1% |
| Guamanians/Chamorros | 99.9 /100 | #59 | Exceptional 15.1% |
| Puget Sound Salish | 99.8 /100 | #60 | Exceptional 15.2% |
| Immigrants | Bosnia and Herzegovina | 99.8 /100 | #61 | Exceptional 15.2% |
| Immigrants | Armenia | 99.8 /100 | #62 | Exceptional 15.2% |
Demographics Similar to Immigrants from Venezuela by Single Father Poverty
In terms of single father poverty, the demographic groups most similar to Immigrants from Venezuela are Ukrainian (16.4%, a difference of 0.030%), Russian (16.4%, a difference of 0.050%), Latvian (16.5%, a difference of 0.11%), Panamanian (16.4%, a difference of 0.13%), and Immigrants from Burma/Myanmar (16.5%, a difference of 0.16%).
| Demographics | Rating | Rank | Single Father Poverty |
| Serbians | 40.9 /100 | #179 | Average 16.4% |
| Immigrants | Latin America | 37.2 /100 | #180 | Fair 16.4% |
| Immigrants | Western Africa | 36.0 /100 | #181 | Fair 16.4% |
| Immigrants | Italy | 35.7 /100 | #182 | Fair 16.4% |
| Aleuts | 35.3 /100 | #183 | Fair 16.4% |
| Cambodians | 34.6 /100 | #184 | Fair 16.4% |
| Panamanians | 33.6 /100 | #185 | Fair 16.4% |
| Immigrants | Venezuela | 31.0 /100 | #186 | Fair 16.4% |
| Ukrainians | 30.4 /100 | #187 | Fair 16.4% |
| Russians | 30.1 /100 | #188 | Fair 16.4% |
| Latvians | 28.9 /100 | #189 | Fair 16.5% |
| Immigrants | Burma/Myanmar | 28.0 /100 | #190 | Fair 16.5% |
| Immigrants | Guyana | 27.1 /100 | #191 | Fair 16.5% |
| Immigrants | Switzerland | 24.8 /100 | #192 | Fair 16.5% |
| Ecuadorians | 24.5 /100 | #193 | Fair 16.5% |