Iranian vs Immigrants from Poland Seniors Poverty Over the Age of 65
COMPARE
Iranian
Immigrants from Poland
Seniors Poverty Over the Age of 65
Seniors Poverty Over the Age of 65 Comparison
Iranians
Immigrants from Poland
9.8%
SENIORS POVERTY OVER THE AGE OF 65
98.9/ 100
METRIC RATING
61st/ 347
METRIC RANK
10.1%
SENIORS POVERTY OVER THE AGE OF 65
97.2/ 100
METRIC RATING
83rd/ 347
METRIC RANK
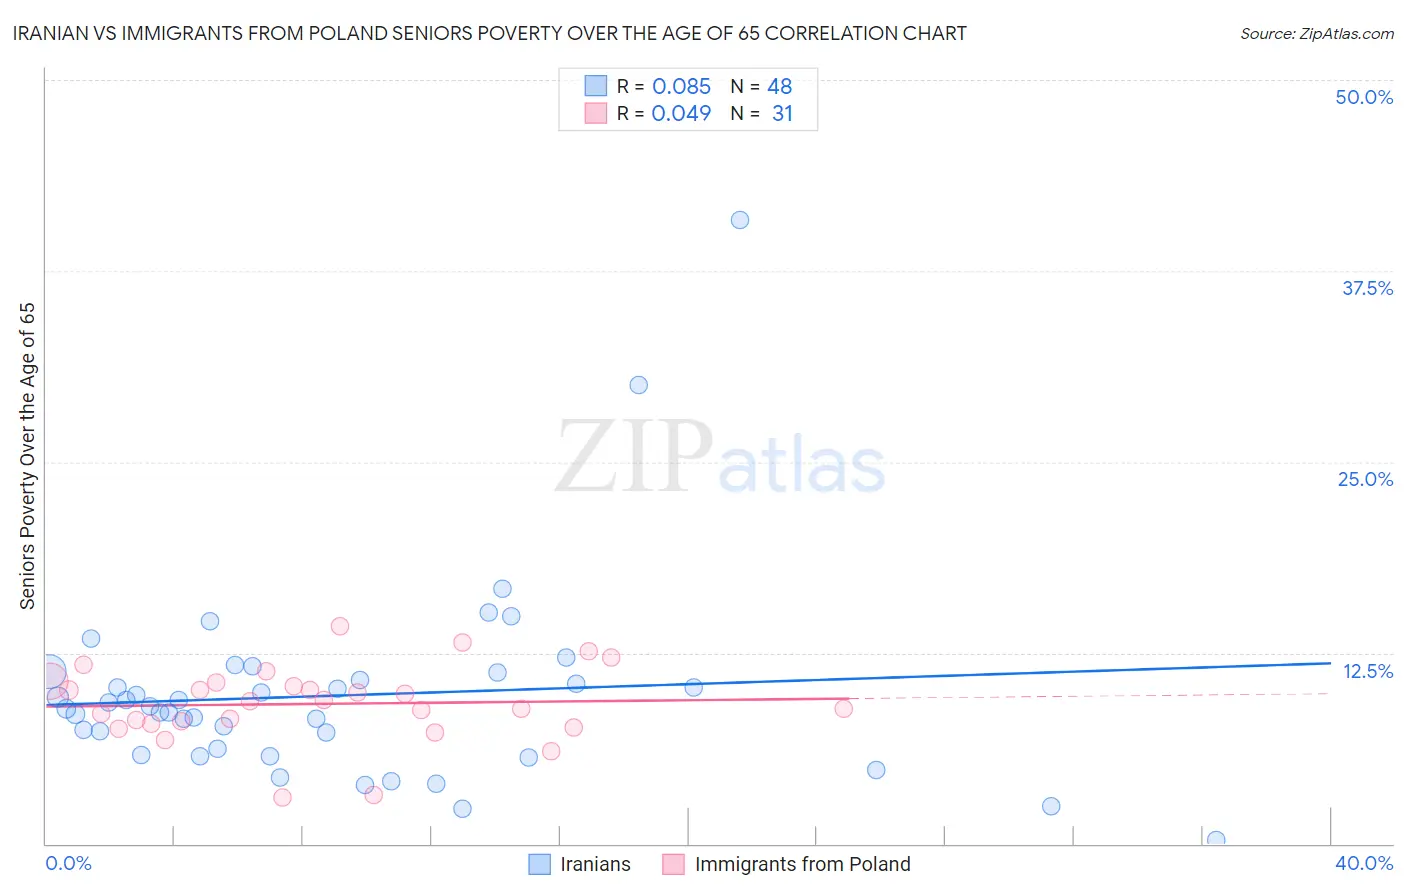
Iranian vs Immigrants from Poland Seniors Poverty Over the Age of 65 Correlation Chart
The statistical analysis conducted on geographies consisting of 315,982,705 people shows a slight positive correlation between the proportion of Iranians and poverty level among seniors over the age of 65 in the United States with a correlation coefficient (R) of 0.085 and weighted average of 9.8%. Similarly, the statistical analysis conducted on geographies consisting of 304,182,133 people shows no correlation between the proportion of Immigrants from Poland and poverty level among seniors over the age of 65 in the United States with a correlation coefficient (R) of 0.049 and weighted average of 10.1%, a difference of 2.4%.
Seniors Poverty Over the Age of 65 Correlation Summary
| Measurement | Iranian | Immigrants from Poland |
| Minimum | 0.21% | 3.0% |
| Maximum | 40.9% | 14.3% |
| Range | 40.7% | 11.2% |
| Mean | 9.7% | 9.2% |
| Median | 8.9% | 9.3% |
| Interquartile 25% (IQ1) | 6.0% | 7.8% |
| Interquartile 75% (IQ3) | 10.9% | 10.5% |
| Interquartile Range (IQR) | 5.0% | 2.7% |
| Standard Deviation (Sample) | 6.5% | 2.5% |
| Standard Deviation (Population) | 6.5% | 2.5% |
Similar Demographics by Seniors Poverty Over the Age of 65
Demographics Similar to Iranians by Seniors Poverty Over the Age of 65
In terms of seniors poverty over the age of 65, the demographic groups most similar to Iranians are French Canadian (9.8%, a difference of 0.040%), Celtic (9.8%, a difference of 0.080%), Immigrants from Canada (9.8%, a difference of 0.11%), Macedonian (9.9%, a difference of 0.22%), and Serbian (9.8%, a difference of 0.27%).
| Demographics | Rating | Rank | Seniors Poverty Over the Age of 65 |
| Immigrants | Northern Europe | 99.2 /100 | #54 | Exceptional 9.8% |
| Afghans | 99.2 /100 | #55 | Exceptional 9.8% |
| Immigrants | England | 99.1 /100 | #56 | Exceptional 9.8% |
| Bolivians | 99.1 /100 | #57 | Exceptional 9.8% |
| Serbians | 99.1 /100 | #58 | Exceptional 9.8% |
| Immigrants | Canada | 99.0 /100 | #59 | Exceptional 9.8% |
| Celtics | 99.0 /100 | #60 | Exceptional 9.8% |
| Iranians | 98.9 /100 | #61 | Exceptional 9.8% |
| French Canadians | 98.9 /100 | #62 | Exceptional 9.8% |
| Macedonians | 98.8 /100 | #63 | Exceptional 9.9% |
| Immigrants | North America | 98.8 /100 | #64 | Exceptional 9.9% |
| Pennsylvania Germans | 98.7 /100 | #65 | Exceptional 9.9% |
| Immigrants | Netherlands | 98.7 /100 | #66 | Exceptional 9.9% |
| Immigrants | Austria | 98.6 /100 | #67 | Exceptional 9.9% |
| Canadians | 98.5 /100 | #68 | Exceptional 9.9% |
Demographics Similar to Immigrants from Poland by Seniors Poverty Over the Age of 65
In terms of seniors poverty over the age of 65, the demographic groups most similar to Immigrants from Poland are Immigrants from Bolivia (10.1%, a difference of 0.030%), Immigrants from Afghanistan (10.1%, a difference of 0.030%), Immigrants from Nepal (10.1%, a difference of 0.030%), Romanian (10.1%, a difference of 0.050%), and Burmese (10.1%, a difference of 0.060%).
| Demographics | Rating | Rank | Seniors Poverty Over the Age of 65 |
| New Zealanders | 97.7 /100 | #76 | Exceptional 10.0% |
| Immigrants | South Africa | 97.7 /100 | #77 | Exceptional 10.0% |
| Whites/Caucasians | 97.5 /100 | #78 | Exceptional 10.0% |
| Immigrants | Ireland | 97.5 /100 | #79 | Exceptional 10.0% |
| Koreans | 97.4 /100 | #80 | Exceptional 10.1% |
| Immigrants | Sri Lanka | 97.3 /100 | #81 | Exceptional 10.1% |
| Immigrants | Bolivia | 97.3 /100 | #82 | Exceptional 10.1% |
| Immigrants | Poland | 97.2 /100 | #83 | Exceptional 10.1% |
| Immigrants | Afghanistan | 97.2 /100 | #84 | Exceptional 10.1% |
| Immigrants | Nepal | 97.2 /100 | #85 | Exceptional 10.1% |
| Romanians | 97.2 /100 | #86 | Exceptional 10.1% |
| Burmese | 97.2 /100 | #87 | Exceptional 10.1% |
| Jordanians | 97.1 /100 | #88 | Exceptional 10.1% |
| Immigrants | Bulgaria | 97.0 /100 | #89 | Exceptional 10.1% |
| Ukrainians | 96.9 /100 | #90 | Exceptional 10.1% |