Iranian vs Immigrants from Poland 12th Grade, No Diploma
COMPARE
Iranian
Immigrants from Poland
12th Grade, No Diploma
12th Grade, No Diploma Comparison
Iranians
Immigrants from Poland
93.1%
12TH GRADE, NO DIPLOMA
99.9/ 100
METRIC RATING
29th/ 347
METRIC RANK
91.6%
12TH GRADE, NO DIPLOMA
82.3/ 100
METRIC RATING
140th/ 347
METRIC RANK
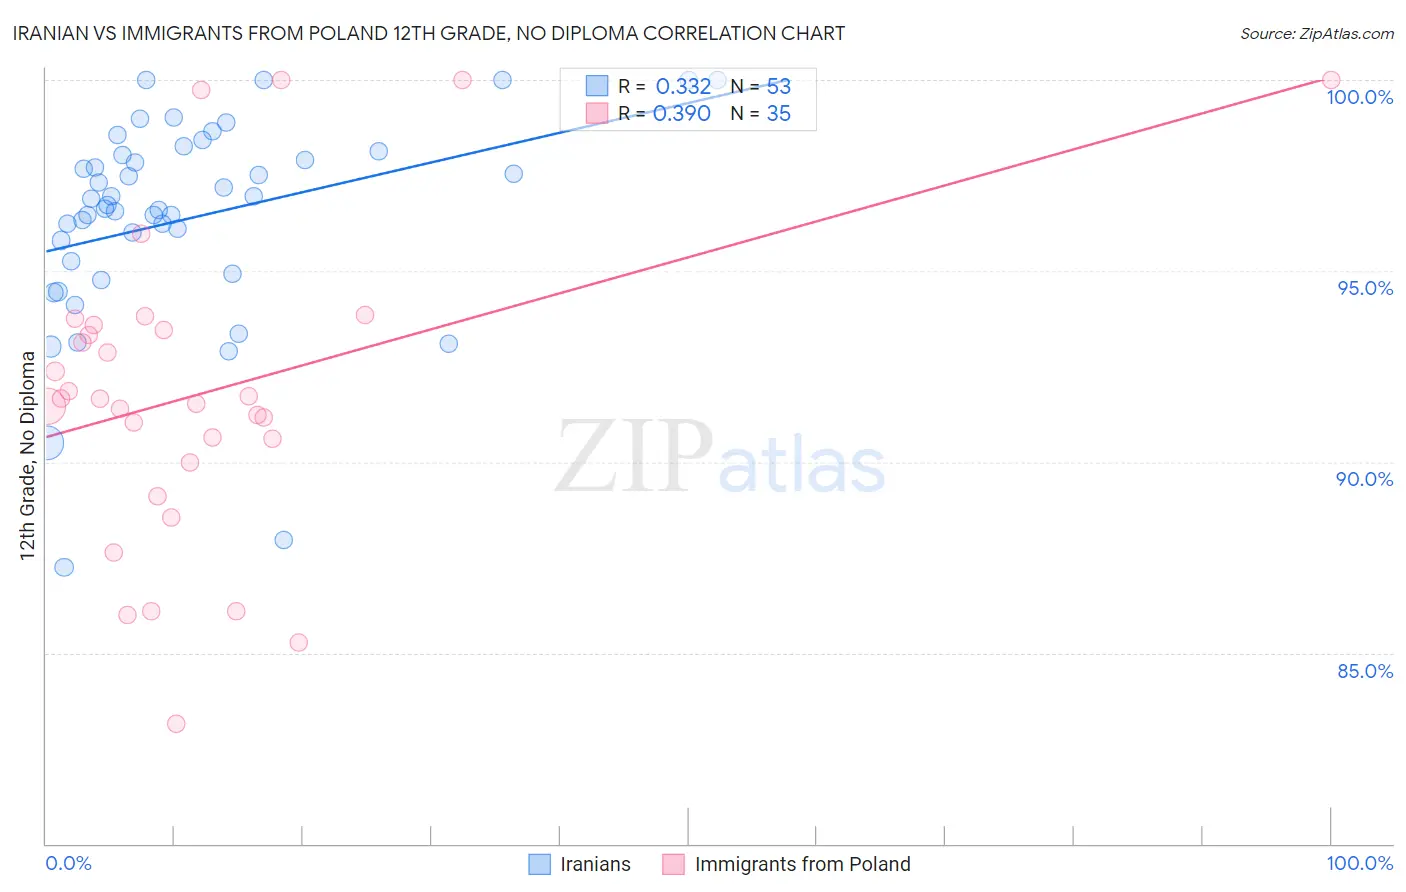
Iranian vs Immigrants from Poland 12th Grade, No Diploma Correlation Chart
The statistical analysis conducted on geographies consisting of 316,901,778 people shows a mild positive correlation between the proportion of Iranians and percentage of population with at least 12th grade (no diploma) education in the United States with a correlation coefficient (R) of 0.332 and weighted average of 93.1%. Similarly, the statistical analysis conducted on geographies consisting of 304,861,877 people shows a mild positive correlation between the proportion of Immigrants from Poland and percentage of population with at least 12th grade (no diploma) education in the United States with a correlation coefficient (R) of 0.390 and weighted average of 91.6%, a difference of 1.6%.
12th Grade, No Diploma Correlation Summary
| Measurement | Iranian | Immigrants from Poland |
| Minimum | 87.2% | 83.1% |
| Maximum | 100.0% | 100.0% |
| Range | 12.8% | 16.9% |
| Mean | 96.4% | 91.8% |
| Median | 96.7% | 91.7% |
| Interquartile 25% (IQ1) | 95.1% | 90.0% |
| Interquartile 75% (IQ3) | 98.1% | 93.6% |
| Interquartile Range (IQR) | 3.0% | 3.6% |
| Standard Deviation (Sample) | 2.7% | 4.1% |
| Standard Deviation (Population) | 2.7% | 4.0% |
Similar Demographics by 12th Grade, No Diploma
Demographics Similar to Iranians by 12th Grade, No Diploma
In terms of 12th grade, no diploma, the demographic groups most similar to Iranians are Immigrants from Lithuania (93.1%, a difference of 0.0%), Immigrants from Northern Europe (93.1%, a difference of 0.010%), Immigrants from Ireland (93.1%, a difference of 0.020%), European (93.1%, a difference of 0.030%), and Cypriot (93.1%, a difference of 0.050%).
| Demographics | Rating | Rank | 12th Grade, No Diploma |
| Estonians | 99.9 /100 | #22 | Exceptional 93.2% |
| Scandinavians | 99.9 /100 | #23 | Exceptional 93.2% |
| Thais | 99.9 /100 | #24 | Exceptional 93.2% |
| Czechs | 99.9 /100 | #25 | Exceptional 93.2% |
| Russians | 99.9 /100 | #26 | Exceptional 93.2% |
| Cypriots | 99.9 /100 | #27 | Exceptional 93.1% |
| Immigrants | Northern Europe | 99.9 /100 | #28 | Exceptional 93.1% |
| Iranians | 99.9 /100 | #29 | Exceptional 93.1% |
| Immigrants | Lithuania | 99.9 /100 | #30 | Exceptional 93.1% |
| Immigrants | Ireland | 99.9 /100 | #31 | Exceptional 93.1% |
| Europeans | 99.9 /100 | #32 | Exceptional 93.1% |
| Immigrants | Scotland | 99.9 /100 | #33 | Exceptional 93.0% |
| Okinawans | 99.9 /100 | #34 | Exceptional 93.0% |
| English | 99.9 /100 | #35 | Exceptional 93.0% |
| Scottish | 99.9 /100 | #36 | Exceptional 93.0% |
Demographics Similar to Immigrants from Poland by 12th Grade, No Diploma
In terms of 12th grade, no diploma, the demographic groups most similar to Immigrants from Poland are Argentinean (91.6%, a difference of 0.010%), Immigrants from Egypt (91.6%, a difference of 0.030%), Immigrants from Venezuela (91.6%, a difference of 0.030%), Immigrants from Argentina (91.6%, a difference of 0.030%), and Arab (91.6%, a difference of 0.040%).
| Demographics | Rating | Rank | 12th Grade, No Diploma |
| Immigrants | Italy | 88.3 /100 | #133 | Excellent 91.7% |
| Venezuelans | 88.2 /100 | #134 | Excellent 91.7% |
| Immigrants | Bosnia and Herzegovina | 87.3 /100 | #135 | Excellent 91.7% |
| Chileans | 85.8 /100 | #136 | Excellent 91.7% |
| Alaska Natives | 84.9 /100 | #137 | Excellent 91.6% |
| Arabs | 84.1 /100 | #138 | Excellent 91.6% |
| Immigrants | Egypt | 83.9 /100 | #139 | Excellent 91.6% |
| Immigrants | Poland | 82.3 /100 | #140 | Excellent 91.6% |
| Argentineans | 82.0 /100 | #141 | Excellent 91.6% |
| Immigrants | Venezuela | 80.9 /100 | #142 | Excellent 91.6% |
| Immigrants | Argentina | 80.7 /100 | #143 | Excellent 91.6% |
| Immigrants | Spain | 80.1 /100 | #144 | Excellent 91.6% |
| Immigrants | Lebanon | 80.0 /100 | #145 | Excellent 91.6% |
| Immigrants | Brazil | 79.8 /100 | #146 | Good 91.5% |
| Pakistanis | 79.6 /100 | #147 | Good 91.5% |