Immigrants from Portugal vs Immigrants from Poland Seniors Poverty Over the Age of 65
COMPARE
Immigrants from Portugal
Immigrants from Poland
Seniors Poverty Over the Age of 65
Seniors Poverty Over the Age of 65 Comparison
Immigrants from Portugal
Immigrants from Poland
12.1%
SENIORS POVERTY OVER THE AGE OF 65
0.8/ 100
METRIC RATING
244th/ 347
METRIC RANK
10.1%
SENIORS POVERTY OVER THE AGE OF 65
97.2/ 100
METRIC RATING
83rd/ 347
METRIC RANK
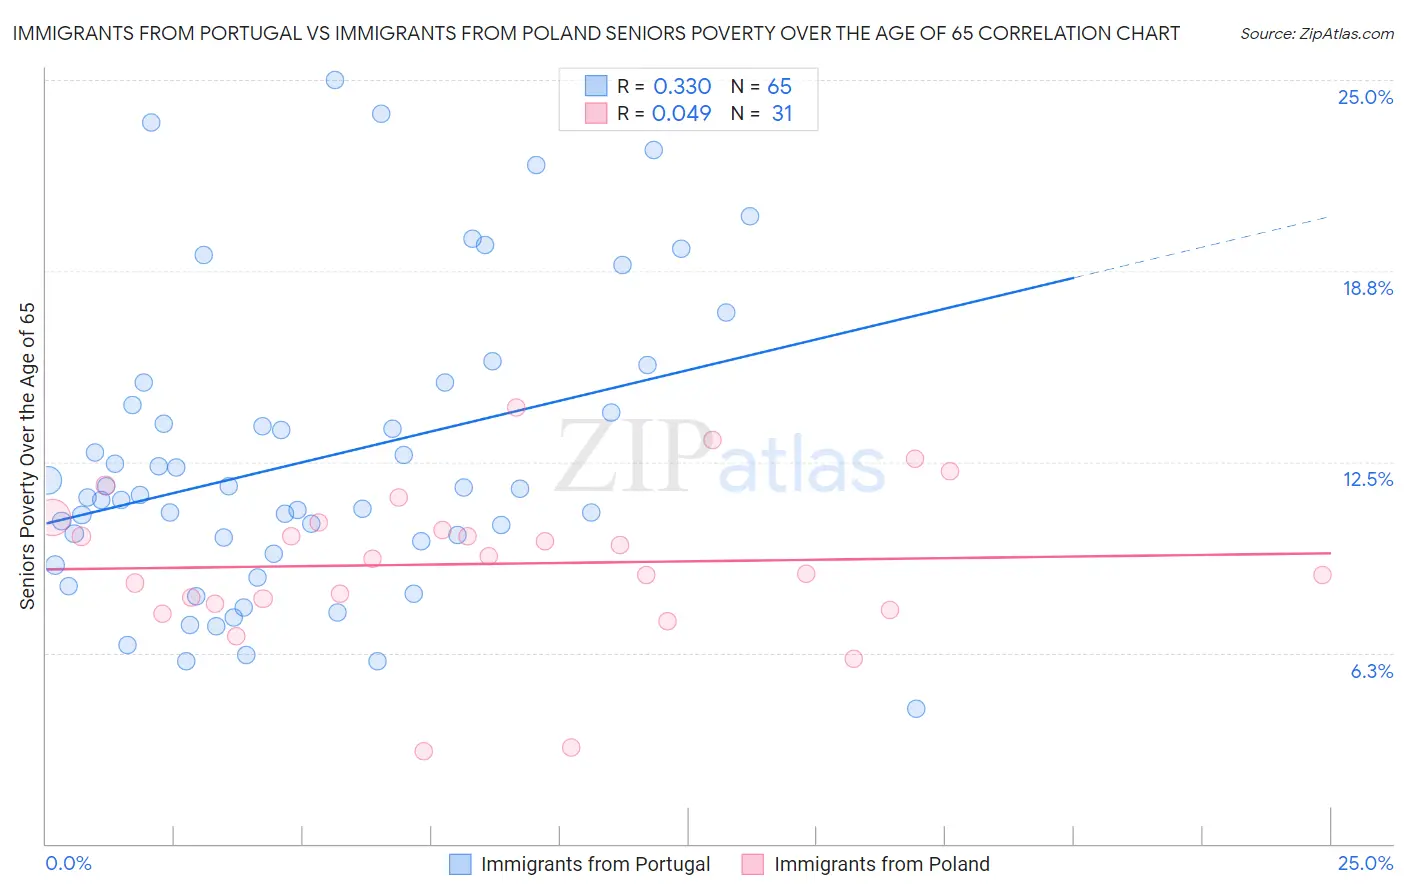
Immigrants from Portugal vs Immigrants from Poland Seniors Poverty Over the Age of 65 Correlation Chart
The statistical analysis conducted on geographies consisting of 174,566,168 people shows a mild positive correlation between the proportion of Immigrants from Portugal and poverty level among seniors over the age of 65 in the United States with a correlation coefficient (R) of 0.330 and weighted average of 12.1%. Similarly, the statistical analysis conducted on geographies consisting of 304,182,133 people shows no correlation between the proportion of Immigrants from Poland and poverty level among seniors over the age of 65 in the United States with a correlation coefficient (R) of 0.049 and weighted average of 10.1%, a difference of 20.3%.
Seniors Poverty Over the Age of 65 Correlation Summary
| Measurement | Immigrants from Portugal | Immigrants from Poland |
| Minimum | 4.4% | 3.0% |
| Maximum | 25.0% | 14.3% |
| Range | 20.6% | 11.2% |
| Mean | 12.6% | 9.2% |
| Median | 11.4% | 9.3% |
| Interquartile 25% (IQ1) | 9.7% | 7.8% |
| Interquartile 75% (IQ3) | 14.7% | 10.5% |
| Interquartile Range (IQR) | 5.0% | 2.7% |
| Standard Deviation (Sample) | 4.8% | 2.5% |
| Standard Deviation (Population) | 4.8% | 2.5% |
Similar Demographics by Seniors Poverty Over the Age of 65
Demographics Similar to Immigrants from Portugal by Seniors Poverty Over the Age of 65
In terms of seniors poverty over the age of 65, the demographic groups most similar to Immigrants from Portugal are Chippewa (12.1%, a difference of 0.11%), Uruguayan (12.1%, a difference of 0.22%), Cree (12.1%, a difference of 0.22%), Japanese (12.2%, a difference of 0.33%), and Subsaharan African (12.1%, a difference of 0.34%).
| Demographics | Rating | Rank | Seniors Poverty Over the Age of 65 |
| Moroccans | 1.2 /100 | #237 | Tragic 12.0% |
| Seminole | 1.1 /100 | #238 | Tragic 12.0% |
| Immigrants | Spain | 1.0 /100 | #239 | Tragic 12.1% |
| Comanche | 0.9 /100 | #240 | Tragic 12.1% |
| Immigrants | Albania | 0.9 /100 | #241 | Tragic 12.1% |
| Sub-Saharan Africans | 0.9 /100 | #242 | Tragic 12.1% |
| Uruguayans | 0.8 /100 | #243 | Tragic 12.1% |
| Immigrants | Portugal | 0.8 /100 | #244 | Tragic 12.1% |
| Chippewa | 0.7 /100 | #245 | Tragic 12.1% |
| Cree | 0.7 /100 | #246 | Tragic 12.1% |
| Japanese | 0.6 /100 | #247 | Tragic 12.2% |
| Spanish Americans | 0.6 /100 | #248 | Tragic 12.2% |
| Ute | 0.6 /100 | #249 | Tragic 12.2% |
| Immigrants | Liberia | 0.5 /100 | #250 | Tragic 12.2% |
| Somalis | 0.3 /100 | #251 | Tragic 12.3% |
Demographics Similar to Immigrants from Poland by Seniors Poverty Over the Age of 65
In terms of seniors poverty over the age of 65, the demographic groups most similar to Immigrants from Poland are Immigrants from Bolivia (10.1%, a difference of 0.030%), Immigrants from Afghanistan (10.1%, a difference of 0.030%), Immigrants from Nepal (10.1%, a difference of 0.030%), Romanian (10.1%, a difference of 0.050%), and Burmese (10.1%, a difference of 0.060%).
| Demographics | Rating | Rank | Seniors Poverty Over the Age of 65 |
| New Zealanders | 97.7 /100 | #76 | Exceptional 10.0% |
| Immigrants | South Africa | 97.7 /100 | #77 | Exceptional 10.0% |
| Whites/Caucasians | 97.5 /100 | #78 | Exceptional 10.0% |
| Immigrants | Ireland | 97.5 /100 | #79 | Exceptional 10.0% |
| Koreans | 97.4 /100 | #80 | Exceptional 10.1% |
| Immigrants | Sri Lanka | 97.3 /100 | #81 | Exceptional 10.1% |
| Immigrants | Bolivia | 97.3 /100 | #82 | Exceptional 10.1% |
| Immigrants | Poland | 97.2 /100 | #83 | Exceptional 10.1% |
| Immigrants | Afghanistan | 97.2 /100 | #84 | Exceptional 10.1% |
| Immigrants | Nepal | 97.2 /100 | #85 | Exceptional 10.1% |
| Romanians | 97.2 /100 | #86 | Exceptional 10.1% |
| Burmese | 97.2 /100 | #87 | Exceptional 10.1% |
| Jordanians | 97.1 /100 | #88 | Exceptional 10.1% |
| Immigrants | Bulgaria | 97.0 /100 | #89 | Exceptional 10.1% |
| Ukrainians | 96.9 /100 | #90 | Exceptional 10.1% |