Inupiat vs Celtic Child Poverty Under the Age of 5
COMPARE
Inupiat
Celtic
Child Poverty Under the Age of 5
Child Poverty Under the Age of 5 Comparison
Inupiat
Celtics
22.0%
CHILD POVERTY UNDER THE AGE OF 5
0.0/ 100
METRIC RATING
303rd/ 347
METRIC RANK
17.9%
CHILD POVERTY UNDER THE AGE OF 5
18.3/ 100
METRIC RATING
198th/ 347
METRIC RANK
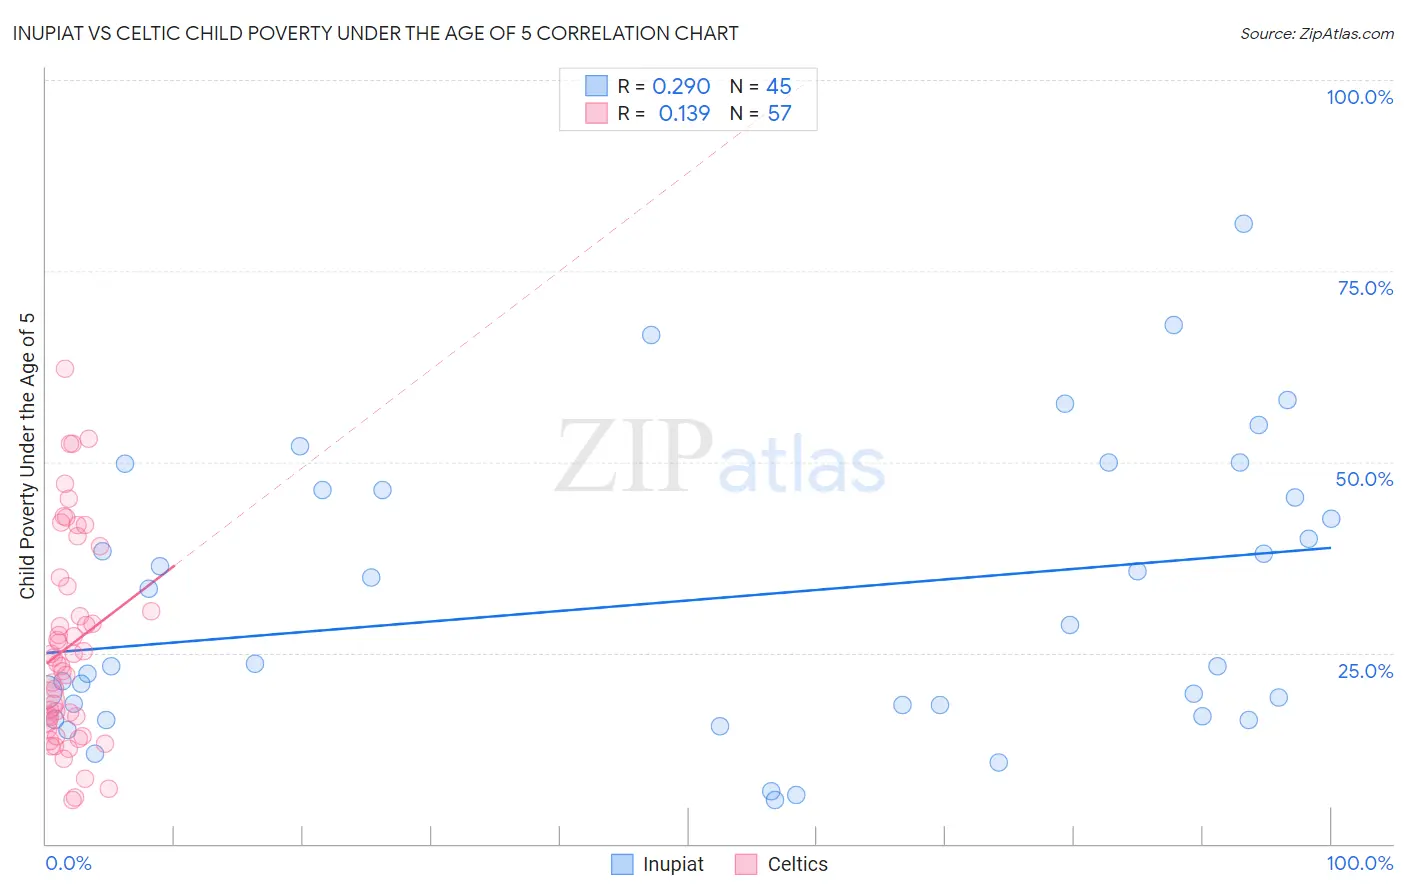
Inupiat vs Celtic Child Poverty Under the Age of 5 Correlation Chart
The statistical analysis conducted on geographies consisting of 95,492,262 people shows a weak positive correlation between the proportion of Inupiat and poverty level among children under the age of 5 in the United States with a correlation coefficient (R) of 0.290 and weighted average of 22.0%. Similarly, the statistical analysis conducted on geographies consisting of 165,160,308 people shows a poor positive correlation between the proportion of Celtics and poverty level among children under the age of 5 in the United States with a correlation coefficient (R) of 0.139 and weighted average of 17.9%, a difference of 23.0%.
Child Poverty Under the Age of 5 Correlation Summary
| Measurement | Inupiat | Celtic |
| Minimum | 5.8% | 5.7% |
| Maximum | 81.2% | 62.3% |
| Range | 75.5% | 56.5% |
| Mean | 32.0% | 25.8% |
| Median | 23.5% | 23.6% |
| Interquartile 25% (IQ1) | 17.4% | 15.5% |
| Interquartile 75% (IQ3) | 46.3% | 34.3% |
| Interquartile Range (IQR) | 28.8% | 18.8% |
| Standard Deviation (Sample) | 18.5% | 13.4% |
| Standard Deviation (Population) | 18.3% | 13.3% |
Similar Demographics by Child Poverty Under the Age of 5
Demographics Similar to Inupiat by Child Poverty Under the Age of 5
In terms of child poverty under the age of 5, the demographic groups most similar to Inupiat are Iroquois (22.0%, a difference of 0.090%), Immigrants from Guatemala (22.0%, a difference of 0.11%), Immigrants from Central America (22.0%, a difference of 0.25%), Alaskan Athabascan (21.8%, a difference of 0.91%), and Chickasaw (21.8%, a difference of 0.92%).
| Demographics | Rating | Rank | Child Poverty Under the Age of 5 |
| Yaqui | 0.0 /100 | #296 | Tragic 21.7% |
| Hispanics or Latinos | 0.0 /100 | #297 | Tragic 21.7% |
| Blackfeet | 0.0 /100 | #298 | Tragic 21.8% |
| Chickasaw | 0.0 /100 | #299 | Tragic 21.8% |
| Alaskan Athabascans | 0.0 /100 | #300 | Tragic 21.8% |
| Immigrants | Central America | 0.0 /100 | #301 | Tragic 22.0% |
| Iroquois | 0.0 /100 | #302 | Tragic 22.0% |
| Inupiat | 0.0 /100 | #303 | Tragic 22.0% |
| Immigrants | Guatemala | 0.0 /100 | #304 | Tragic 22.0% |
| Immigrants | Mexico | 0.0 /100 | #305 | Tragic 22.2% |
| Indonesians | 0.0 /100 | #306 | Tragic 22.3% |
| Immigrants | Bahamas | 0.0 /100 | #307 | Tragic 22.7% |
| Immigrants | Dominica | 0.0 /100 | #308 | Tragic 22.7% |
| Houma | 0.0 /100 | #309 | Tragic 22.7% |
| Africans | 0.0 /100 | #310 | Tragic 22.8% |
Demographics Similar to Celtics by Child Poverty Under the Age of 5
In terms of child poverty under the age of 5, the demographic groups most similar to Celtics are Hungarian (17.9%, a difference of 0.010%), Immigrants from Kenya (17.9%, a difference of 0.28%), Immigrants from Portugal (17.8%, a difference of 0.60%), Iraqi (18.0%, a difference of 0.81%), and Ugandan (18.0%, a difference of 0.82%).
| Demographics | Rating | Rank | Child Poverty Under the Age of 5 |
| Immigrants | Afghanistan | 27.9 /100 | #191 | Fair 17.7% |
| Immigrants | Uruguay | 27.8 /100 | #192 | Fair 17.7% |
| Immigrants | Uganda | 25.0 /100 | #193 | Fair 17.7% |
| French Canadians | 24.6 /100 | #194 | Fair 17.7% |
| Sierra Leoneans | 24.1 /100 | #195 | Fair 17.7% |
| Immigrants | Portugal | 22.2 /100 | #196 | Fair 17.8% |
| Immigrants | Kenya | 20.0 /100 | #197 | Fair 17.9% |
| Celtics | 18.3 /100 | #198 | Poor 17.9% |
| Hungarians | 18.3 /100 | #199 | Poor 17.9% |
| Iraqis | 14.0 /100 | #200 | Poor 18.0% |
| Ugandans | 13.9 /100 | #201 | Poor 18.0% |
| Japanese | 13.8 /100 | #202 | Poor 18.1% |
| Immigrants | Cambodia | 13.7 /100 | #203 | Poor 18.1% |
| Immigrants | Eastern Africa | 13.4 /100 | #204 | Poor 18.1% |
| Spaniards | 12.8 /100 | #205 | Poor 18.1% |