Indonesian vs Ottawa Seniors Poverty Over the Age of 65
COMPARE
Indonesian
Ottawa
Seniors Poverty Over the Age of 65
Seniors Poverty Over the Age of 65 Comparison
Indonesians
Ottawa
11.5%
SENIORS POVERTY OVER THE AGE OF 65
10.4/ 100
METRIC RATING
211th/ 347
METRIC RANK
10.4%
SENIORS POVERTY OVER THE AGE OF 65
88.5/ 100
METRIC RATING
128th/ 347
METRIC RANK
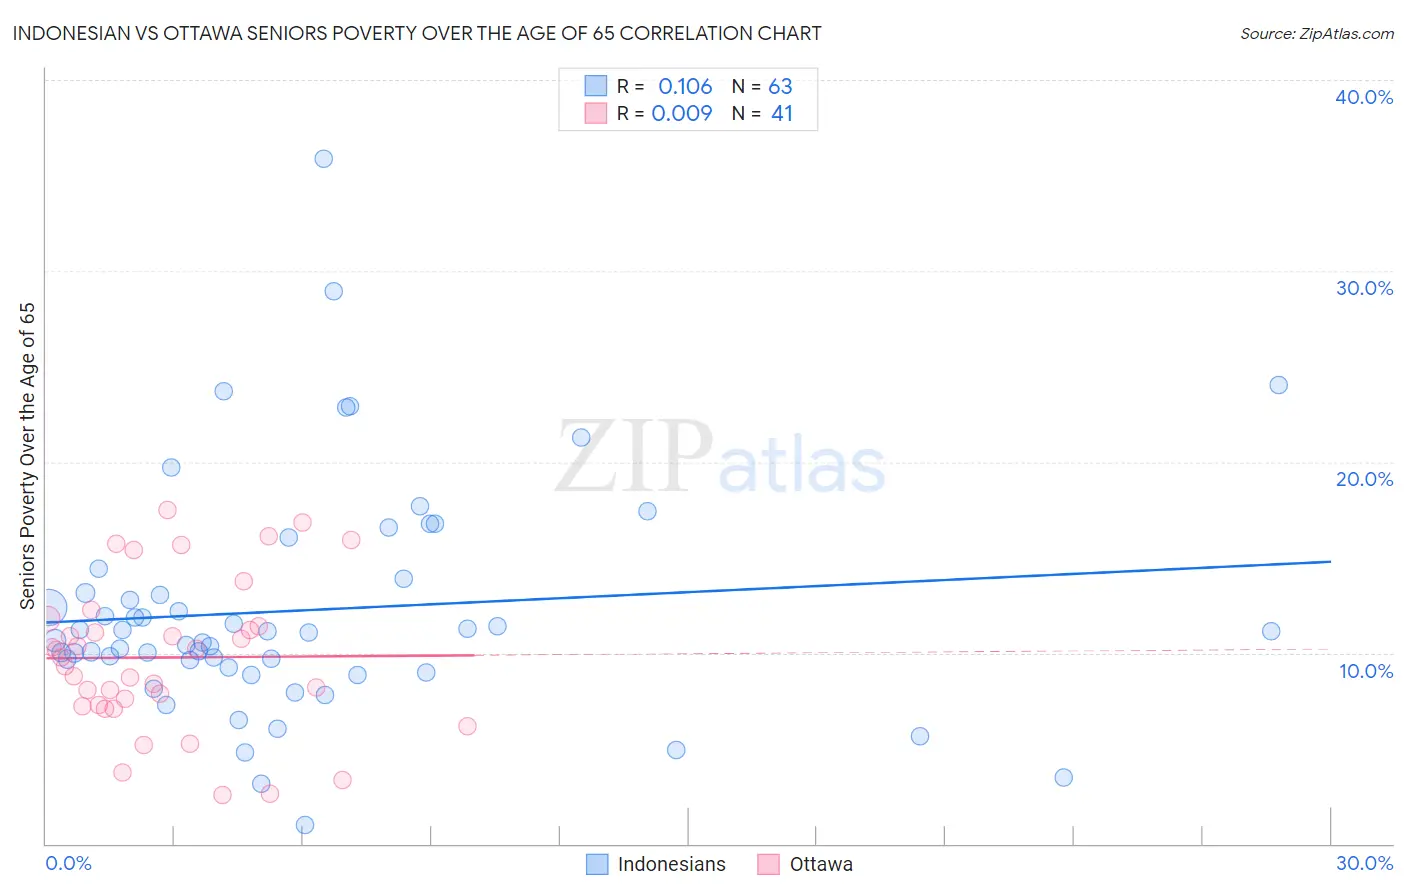
Indonesian vs Ottawa Seniors Poverty Over the Age of 65 Correlation Chart
The statistical analysis conducted on geographies consisting of 162,386,523 people shows a poor positive correlation between the proportion of Indonesians and poverty level among seniors over the age of 65 in the United States with a correlation coefficient (R) of 0.106 and weighted average of 11.5%. Similarly, the statistical analysis conducted on geographies consisting of 49,903,467 people shows no correlation between the proportion of Ottawa and poverty level among seniors over the age of 65 in the United States with a correlation coefficient (R) of 0.009 and weighted average of 10.4%, a difference of 9.8%.
Seniors Poverty Over the Age of 65 Correlation Summary
| Measurement | Indonesian | Ottawa |
| Minimum | 0.97% | 2.6% |
| Maximum | 35.9% | 17.5% |
| Range | 34.9% | 14.9% |
| Mean | 12.2% | 9.8% |
| Median | 11.0% | 9.8% |
| Interquartile 25% (IQ1) | 9.2% | 7.2% |
| Interquartile 75% (IQ3) | 13.9% | 11.6% |
| Interquartile Range (IQR) | 4.7% | 4.3% |
| Standard Deviation (Sample) | 6.1% | 3.9% |
| Standard Deviation (Population) | 6.1% | 3.9% |
Similar Demographics by Seniors Poverty Over the Age of 65
Demographics Similar to Indonesians by Seniors Poverty Over the Age of 65
In terms of seniors poverty over the age of 65, the demographic groups most similar to Indonesians are Ugandan (11.4%, a difference of 0.19%), Immigrants from China (11.5%, a difference of 0.20%), Paraguayan (11.4%, a difference of 0.21%), South American Indian (11.4%, a difference of 0.28%), and Nepalese (11.5%, a difference of 0.36%).
| Demographics | Rating | Rank | Seniors Poverty Over the Age of 65 |
| Israelis | 16.5 /100 | #204 | Poor 11.3% |
| Brazilians | 15.4 /100 | #205 | Poor 11.3% |
| Choctaw | 14.5 /100 | #206 | Poor 11.4% |
| Immigrants | Western Asia | 13.6 /100 | #207 | Poor 11.4% |
| South American Indians | 11.7 /100 | #208 | Poor 11.4% |
| Paraguayans | 11.3 /100 | #209 | Poor 11.4% |
| Ugandans | 11.2 /100 | #210 | Poor 11.4% |
| Indonesians | 10.4 /100 | #211 | Poor 11.5% |
| Immigrants | China | 9.5 /100 | #212 | Tragic 11.5% |
| Nepalese | 8.9 /100 | #213 | Tragic 11.5% |
| Immigrants | Russia | 8.8 /100 | #214 | Tragic 11.5% |
| French American Indians | 8.7 /100 | #215 | Tragic 11.5% |
| Immigrants | Morocco | 6.8 /100 | #216 | Tragic 11.6% |
| Immigrants | Africa | 6.4 /100 | #217 | Tragic 11.6% |
| Immigrants | Ukraine | 5.7 /100 | #218 | Tragic 11.6% |
Demographics Similar to Ottawa by Seniors Poverty Over the Age of 65
In terms of seniors poverty over the age of 65, the demographic groups most similar to Ottawa are Immigrants from Iran (10.4%, a difference of 0.020%), Immigrants from Oceania (10.4%, a difference of 0.020%), Immigrants from Hungary (10.4%, a difference of 0.13%), Cambodian (10.4%, a difference of 0.13%), and Egyptian (10.5%, a difference of 0.17%).
| Demographics | Rating | Rank | Seniors Poverty Over the Age of 65 |
| Immigrants | Iraq | 90.7 /100 | #121 | Exceptional 10.4% |
| Immigrants | Moldova | 90.7 /100 | #122 | Exceptional 10.4% |
| Hmong | 90.0 /100 | #123 | Exceptional 10.4% |
| Asians | 89.9 /100 | #124 | Excellent 10.4% |
| Immigrants | Philippines | 89.4 /100 | #125 | Excellent 10.4% |
| Immigrants | Hungary | 89.1 /100 | #126 | Excellent 10.4% |
| Cambodians | 89.1 /100 | #127 | Excellent 10.4% |
| Ottawa | 88.5 /100 | #128 | Excellent 10.4% |
| Immigrants | Iran | 88.4 /100 | #129 | Excellent 10.4% |
| Immigrants | Oceania | 88.4 /100 | #130 | Excellent 10.4% |
| Egyptians | 87.8 /100 | #131 | Excellent 10.5% |
| Immigrants | Turkey | 87.7 /100 | #132 | Excellent 10.5% |
| Guamanians/Chamorros | 87.5 /100 | #133 | Excellent 10.5% |
| Sierra Leoneans | 86.8 /100 | #134 | Excellent 10.5% |
| Immigrants | Norway | 86.5 /100 | #135 | Excellent 10.5% |