Indonesian vs Immigrants from Eritrea Seniors Poverty Over the Age of 65
COMPARE
Indonesian
Immigrants from Eritrea
Seniors Poverty Over the Age of 65
Seniors Poverty Over the Age of 65 Comparison
Indonesians
Immigrants from Eritrea
11.5%
SENIORS POVERTY OVER THE AGE OF 65
10.4/ 100
METRIC RATING
211th/ 347
METRIC RANK
11.8%
SENIORS POVERTY OVER THE AGE OF 65
2.6/ 100
METRIC RATING
229th/ 347
METRIC RANK
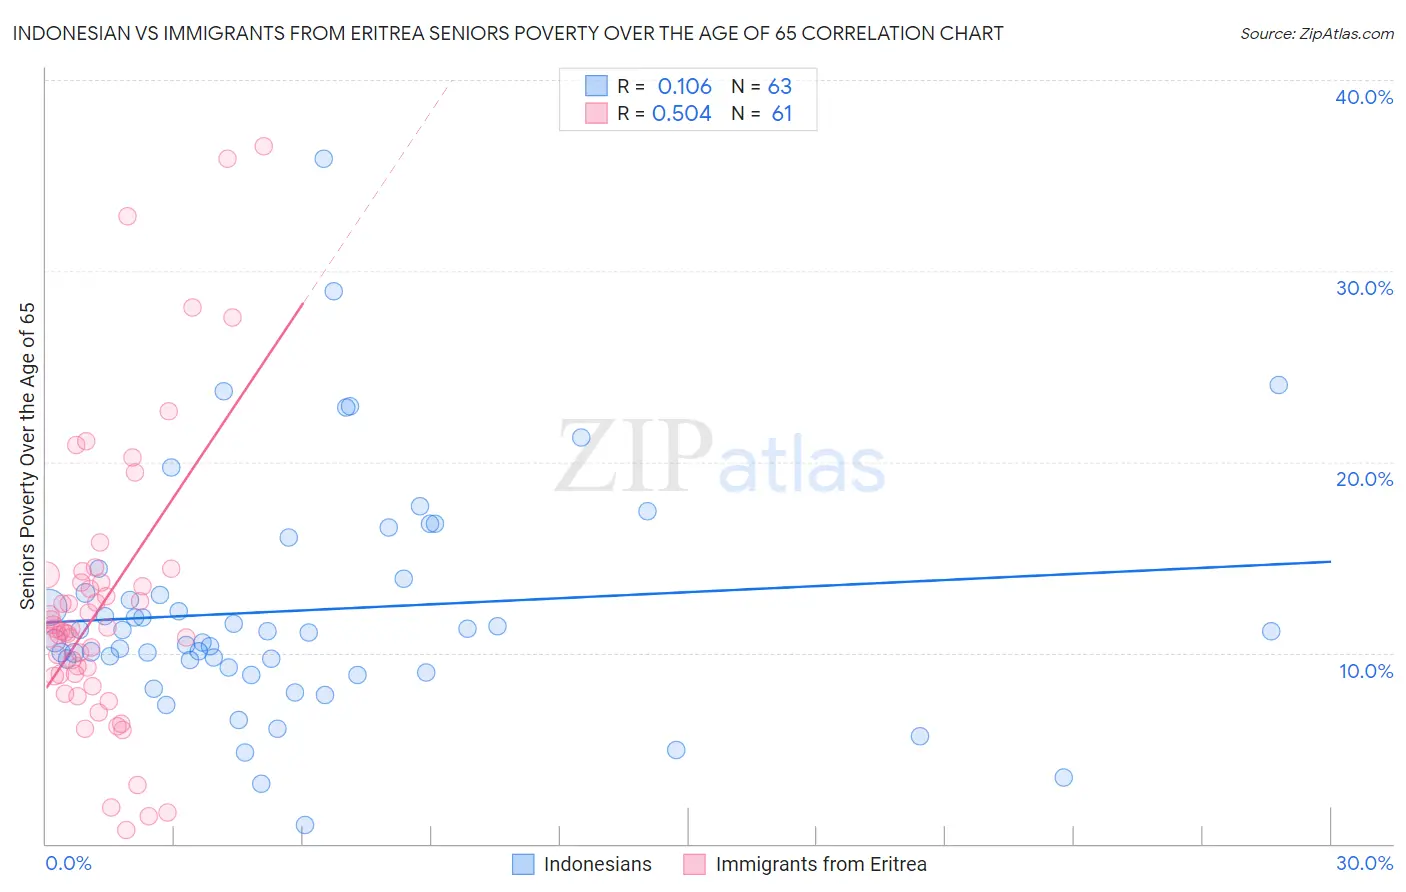
Indonesian vs Immigrants from Eritrea Seniors Poverty Over the Age of 65 Correlation Chart
The statistical analysis conducted on geographies consisting of 162,386,523 people shows a poor positive correlation between the proportion of Indonesians and poverty level among seniors over the age of 65 in the United States with a correlation coefficient (R) of 0.106 and weighted average of 11.5%. Similarly, the statistical analysis conducted on geographies consisting of 104,826,651 people shows a substantial positive correlation between the proportion of Immigrants from Eritrea and poverty level among seniors over the age of 65 in the United States with a correlation coefficient (R) of 0.504 and weighted average of 11.8%, a difference of 3.1%.
Seniors Poverty Over the Age of 65 Correlation Summary
| Measurement | Indonesian | Immigrants from Eritrea |
| Minimum | 0.97% | 0.71% |
| Maximum | 35.9% | 36.6% |
| Range | 34.9% | 35.8% |
| Mean | 12.2% | 12.6% |
| Median | 11.0% | 11.2% |
| Interquartile 25% (IQ1) | 9.2% | 8.8% |
| Interquartile 75% (IQ3) | 13.9% | 13.9% |
| Interquartile Range (IQR) | 4.7% | 5.0% |
| Standard Deviation (Sample) | 6.1% | 7.5% |
| Standard Deviation (Population) | 6.1% | 7.4% |
Demographics Similar to Indonesians and Immigrants from Eritrea by Seniors Poverty Over the Age of 65
In terms of seniors poverty over the age of 65, the demographic groups most similar to Indonesians are Ugandan (11.4%, a difference of 0.19%), Immigrants from China (11.5%, a difference of 0.20%), Nepalese (11.5%, a difference of 0.36%), Immigrants from Russia (11.5%, a difference of 0.38%), and French American Indian (11.5%, a difference of 0.42%). Similarly, the demographic groups most similar to Immigrants from Eritrea are Immigrants from Costa Rica (11.8%, a difference of 0.080%), Nigerian (11.8%, a difference of 0.40%), Liberian (11.8%, a difference of 0.44%), Immigrants from Belarus (11.8%, a difference of 0.46%), and Bermudan (11.9%, a difference of 0.50%).
| Demographics | Rating | Rank | Seniors Poverty Over the Age of 65 |
| Ugandans | 11.2 /100 | #210 | Poor 11.4% |
| Indonesians | 10.4 /100 | #211 | Poor 11.5% |
| Immigrants | China | 9.5 /100 | #212 | Tragic 11.5% |
| Nepalese | 8.9 /100 | #213 | Tragic 11.5% |
| Immigrants | Russia | 8.8 /100 | #214 | Tragic 11.5% |
| French American Indians | 8.7 /100 | #215 | Tragic 11.5% |
| Immigrants | Morocco | 6.8 /100 | #216 | Tragic 11.6% |
| Immigrants | Africa | 6.4 /100 | #217 | Tragic 11.6% |
| Immigrants | Ukraine | 5.7 /100 | #218 | Tragic 11.6% |
| Arapaho | 5.2 /100 | #219 | Tragic 11.6% |
| Peruvians | 4.2 /100 | #220 | Tragic 11.7% |
| Argentineans | 4.1 /100 | #221 | Tragic 11.7% |
| Immigrants | Chile | 3.9 /100 | #222 | Tragic 11.7% |
| Immigrants | Congo | 3.8 /100 | #223 | Tragic 11.7% |
| Immigrants | Nigeria | 3.4 /100 | #224 | Tragic 11.7% |
| Immigrants | Belarus | 3.2 /100 | #225 | Tragic 11.8% |
| Liberians | 3.2 /100 | #226 | Tragic 11.8% |
| Nigerians | 3.2 /100 | #227 | Tragic 11.8% |
| Immigrants | Costa Rica | 2.7 /100 | #228 | Tragic 11.8% |
| Immigrants | Eritrea | 2.6 /100 | #229 | Tragic 11.8% |
| Bermudans | 2.1 /100 | #230 | Tragic 11.9% |