Sri Lankan vs Ottawa Seniors Poverty Over the Age of 65
COMPARE
Sri Lankan
Ottawa
Seniors Poverty Over the Age of 65
Seniors Poverty Over the Age of 65 Comparison
Sri Lankans
Ottawa
10.9%
SENIORS POVERTY OVER THE AGE OF 65
56.8/ 100
METRIC RATING
169th/ 347
METRIC RANK
10.4%
SENIORS POVERTY OVER THE AGE OF 65
88.5/ 100
METRIC RATING
128th/ 347
METRIC RANK
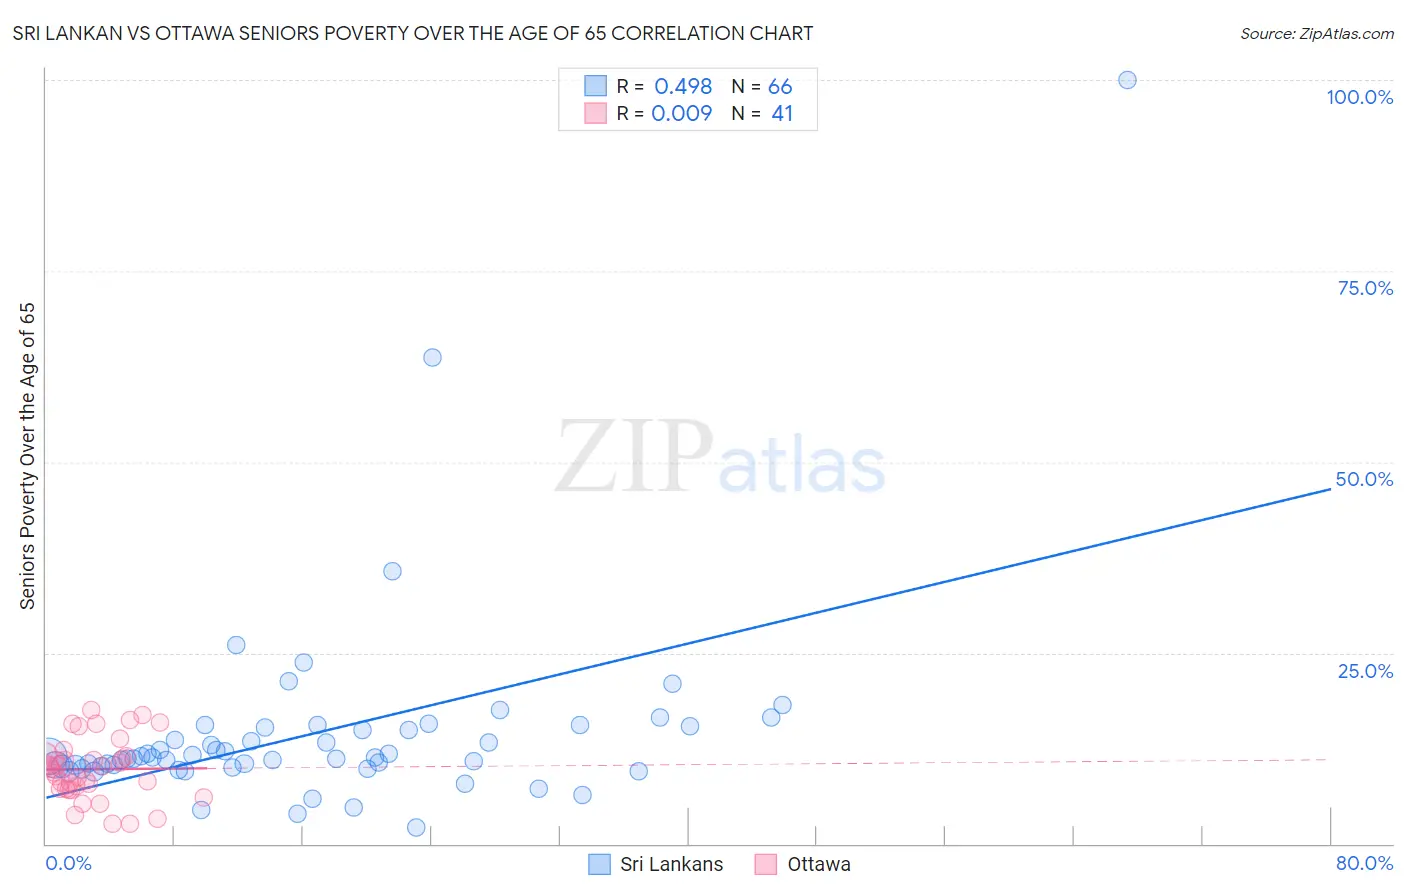
Sri Lankan vs Ottawa Seniors Poverty Over the Age of 65 Correlation Chart
The statistical analysis conducted on geographies consisting of 438,555,706 people shows a moderate positive correlation between the proportion of Sri Lankans and poverty level among seniors over the age of 65 in the United States with a correlation coefficient (R) of 0.498 and weighted average of 10.9%. Similarly, the statistical analysis conducted on geographies consisting of 49,903,467 people shows no correlation between the proportion of Ottawa and poverty level among seniors over the age of 65 in the United States with a correlation coefficient (R) of 0.009 and weighted average of 10.4%, a difference of 4.1%.
Seniors Poverty Over the Age of 65 Correlation Summary
| Measurement | Sri Lankan | Ottawa |
| Minimum | 2.1% | 2.6% |
| Maximum | 100.0% | 17.5% |
| Range | 97.9% | 14.9% |
| Mean | 14.5% | 9.8% |
| Median | 11.3% | 9.8% |
| Interquartile 25% (IQ1) | 10.1% | 7.2% |
| Interquartile 75% (IQ3) | 15.2% | 11.6% |
| Interquartile Range (IQR) | 5.1% | 4.3% |
| Standard Deviation (Sample) | 13.4% | 3.9% |
| Standard Deviation (Population) | 13.3% | 3.9% |
Similar Demographics by Seniors Poverty Over the Age of 65
Demographics Similar to Sri Lankans by Seniors Poverty Over the Age of 65
In terms of seniors poverty over the age of 65, the demographic groups most similar to Sri Lankans are Immigrants from Eastern Europe (10.9%, a difference of 0.090%), Mongolian (10.9%, a difference of 0.10%), Nonimmigrants (10.9%, a difference of 0.16%), Immigrants from Syria (10.9%, a difference of 0.19%), and Alaska Native (10.8%, a difference of 0.32%).
| Demographics | Rating | Rank | Seniors Poverty Over the Age of 65 |
| Immigrants | Indonesia | 64.8 /100 | #162 | Good 10.8% |
| Tsimshian | 64.5 /100 | #163 | Good 10.8% |
| Potawatomi | 62.6 /100 | #164 | Good 10.8% |
| Immigrants | South Eastern Asia | 62.1 /100 | #165 | Good 10.8% |
| Malaysians | 62.0 /100 | #166 | Good 10.8% |
| Alaska Natives | 60.3 /100 | #167 | Good 10.8% |
| Mongolians | 58.0 /100 | #168 | Average 10.9% |
| Sri Lankans | 56.8 /100 | #169 | Average 10.9% |
| Immigrants | Eastern Europe | 55.8 /100 | #170 | Average 10.9% |
| Immigrants | Nonimmigrants | 55.1 /100 | #171 | Average 10.9% |
| Immigrants | Syria | 54.7 /100 | #172 | Average 10.9% |
| Spaniards | 50.7 /100 | #173 | Average 10.9% |
| Immigrants | Sudan | 50.0 /100 | #174 | Average 10.9% |
| Creek | 49.6 /100 | #175 | Average 10.9% |
| Immigrants | Malaysia | 47.9 /100 | #176 | Average 11.0% |
Demographics Similar to Ottawa by Seniors Poverty Over the Age of 65
In terms of seniors poverty over the age of 65, the demographic groups most similar to Ottawa are Immigrants from Iran (10.4%, a difference of 0.020%), Immigrants from Oceania (10.4%, a difference of 0.020%), Immigrants from Hungary (10.4%, a difference of 0.13%), Cambodian (10.4%, a difference of 0.13%), and Egyptian (10.5%, a difference of 0.17%).
| Demographics | Rating | Rank | Seniors Poverty Over the Age of 65 |
| Immigrants | Iraq | 90.7 /100 | #121 | Exceptional 10.4% |
| Immigrants | Moldova | 90.7 /100 | #122 | Exceptional 10.4% |
| Hmong | 90.0 /100 | #123 | Exceptional 10.4% |
| Asians | 89.9 /100 | #124 | Excellent 10.4% |
| Immigrants | Philippines | 89.4 /100 | #125 | Excellent 10.4% |
| Immigrants | Hungary | 89.1 /100 | #126 | Excellent 10.4% |
| Cambodians | 89.1 /100 | #127 | Excellent 10.4% |
| Ottawa | 88.5 /100 | #128 | Excellent 10.4% |
| Immigrants | Iran | 88.4 /100 | #129 | Excellent 10.4% |
| Immigrants | Oceania | 88.4 /100 | #130 | Excellent 10.4% |
| Egyptians | 87.8 /100 | #131 | Excellent 10.5% |
| Immigrants | Turkey | 87.7 /100 | #132 | Excellent 10.5% |
| Guamanians/Chamorros | 87.5 /100 | #133 | Excellent 10.5% |
| Sierra Leoneans | 86.8 /100 | #134 | Excellent 10.5% |
| Immigrants | Norway | 86.5 /100 | #135 | Excellent 10.5% |