Indonesian vs Immigrants from Iran 5th Grade
COMPARE
Indonesian
Immigrants from Iran
5th Grade
5th Grade Comparison
Indonesians
Immigrants from Iran
96.0%
5TH GRADE
0.0/ 100
METRIC RATING
310th/ 347
METRIC RANK
97.4%
5TH GRADE
59.5/ 100
METRIC RATING
162nd/ 347
METRIC RANK
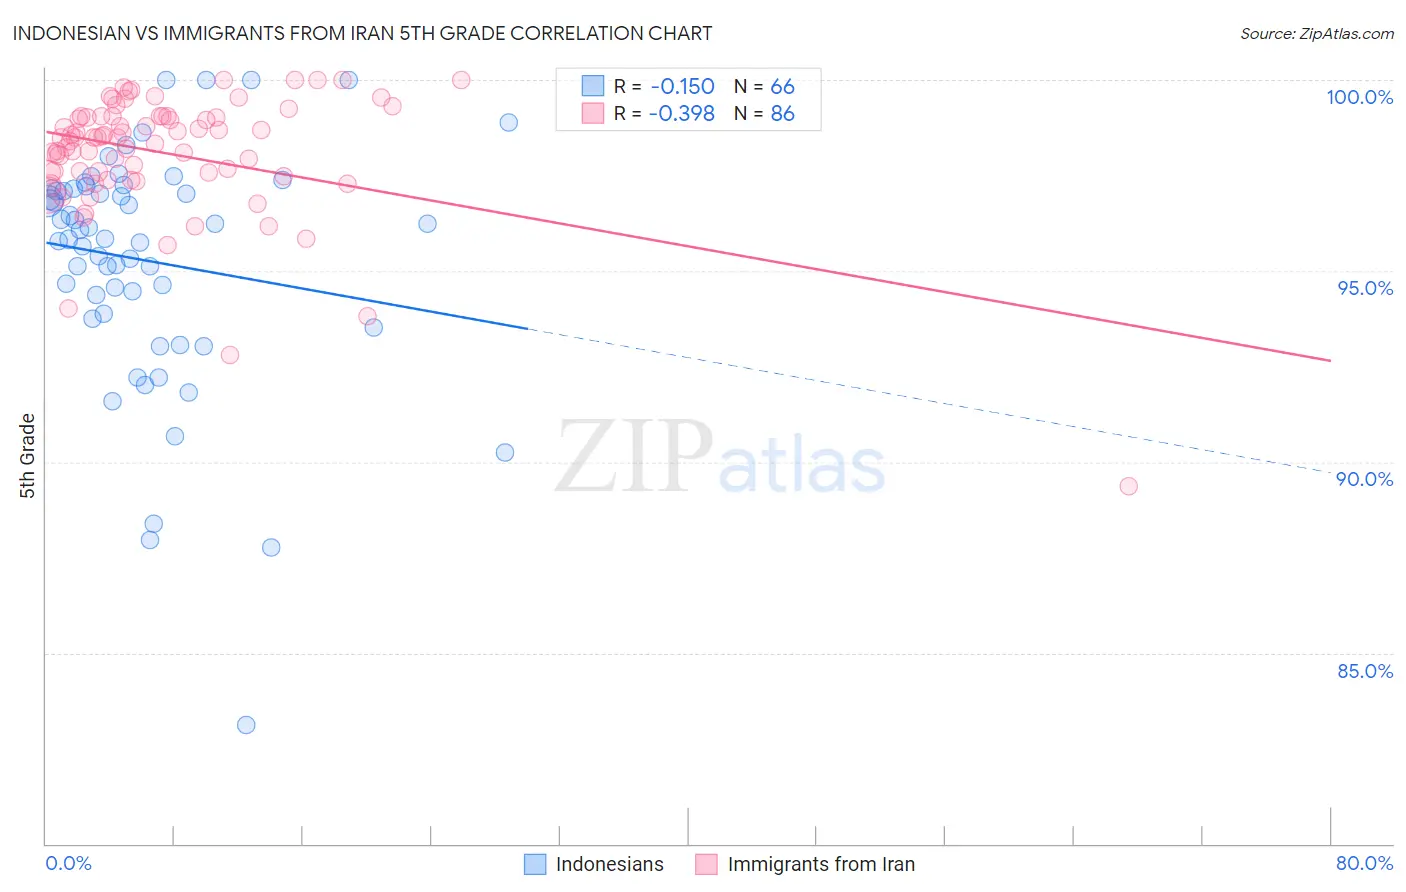
Indonesian vs Immigrants from Iran 5th Grade Correlation Chart
The statistical analysis conducted on geographies consisting of 162,727,113 people shows a poor negative correlation between the proportion of Indonesians and percentage of population with at least 5th grade education in the United States with a correlation coefficient (R) of -0.150 and weighted average of 96.0%. Similarly, the statistical analysis conducted on geographies consisting of 279,867,553 people shows a mild negative correlation between the proportion of Immigrants from Iran and percentage of population with at least 5th grade education in the United States with a correlation coefficient (R) of -0.398 and weighted average of 97.4%, a difference of 1.5%.
5th Grade Correlation Summary
| Measurement | Indonesian | Immigrants from Iran |
| Minimum | 83.1% | 89.4% |
| Maximum | 100.0% | 100.0% |
| Range | 16.9% | 10.6% |
| Mean | 95.3% | 98.1% |
| Median | 96.0% | 98.5% |
| Interquartile 25% (IQ1) | 93.9% | 97.6% |
| Interquartile 75% (IQ3) | 97.1% | 99.0% |
| Interquartile Range (IQR) | 3.3% | 1.5% |
| Standard Deviation (Sample) | 3.1% | 1.7% |
| Standard Deviation (Population) | 3.1% | 1.6% |
Similar Demographics by 5th Grade
Demographics Similar to Indonesians by 5th Grade
In terms of 5th grade, the demographic groups most similar to Indonesians are Immigrants from Bangladesh (96.0%, a difference of 0.020%), Immigrants from Guyana (96.0%, a difference of 0.040%), Ecuadorian (96.0%, a difference of 0.050%), Vietnamese (95.9%, a difference of 0.050%), and Immigrants from Haiti (96.0%, a difference of 0.060%).
| Demographics | Rating | Rank | 5th Grade |
| Puerto Ricans | 0.0 /100 | #303 | Tragic 96.1% |
| Immigrants | Burma/Myanmar | 0.0 /100 | #304 | Tragic 96.1% |
| Immigrants | Laos | 0.0 /100 | #305 | Tragic 96.0% |
| Immigrants | Haiti | 0.0 /100 | #306 | Tragic 96.0% |
| Immigrants | Caribbean | 0.0 /100 | #307 | Tragic 96.0% |
| Ecuadorians | 0.0 /100 | #308 | Tragic 96.0% |
| Immigrants | Guyana | 0.0 /100 | #309 | Tragic 96.0% |
| Indonesians | 0.0 /100 | #310 | Tragic 96.0% |
| Immigrants | Bangladesh | 0.0 /100 | #311 | Tragic 96.0% |
| Vietnamese | 0.0 /100 | #312 | Tragic 95.9% |
| Bangladeshis | 0.0 /100 | #313 | Tragic 95.9% |
| Immigrants | Portugal | 0.0 /100 | #314 | Tragic 95.9% |
| Nicaraguans | 0.0 /100 | #315 | Tragic 95.9% |
| Immigrants | Ecuador | 0.0 /100 | #316 | Tragic 95.8% |
| Belizeans | 0.0 /100 | #317 | Tragic 95.8% |
Demographics Similar to Immigrants from Iran by 5th Grade
In terms of 5th grade, the demographic groups most similar to Immigrants from Iran are Kenyan (97.4%, a difference of 0.0%), Ugandan (97.4%, a difference of 0.0%), Bermudan (97.4%, a difference of 0.0%), Marshallese (97.4%, a difference of 0.010%), and Immigrants from Poland (97.4%, a difference of 0.010%).
| Demographics | Rating | Rank | 5th Grade |
| Immigrants | Bosnia and Herzegovina | 71.0 /100 | #155 | Good 97.4% |
| French American Indians | 70.5 /100 | #156 | Good 97.4% |
| Immigrants | Jordan | 70.4 /100 | #157 | Good 97.4% |
| Albanians | 68.3 /100 | #158 | Good 97.4% |
| Immigrants | Italy | 65.2 /100 | #159 | Good 97.4% |
| Marshallese | 61.2 /100 | #160 | Good 97.4% |
| Kenyans | 59.7 /100 | #161 | Average 97.4% |
| Immigrants | Iran | 59.5 /100 | #162 | Average 97.4% |
| Ugandans | 58.9 /100 | #163 | Average 97.4% |
| Bermudans | 58.8 /100 | #164 | Average 97.4% |
| Immigrants | Poland | 57.9 /100 | #165 | Average 97.4% |
| Apache | 57.2 /100 | #166 | Average 97.4% |
| Immigrants | Belarus | 54.6 /100 | #167 | Average 97.3% |
| Chileans | 54.5 /100 | #168 | Average 97.3% |
| Immigrants | Korea | 54.1 /100 | #169 | Average 97.3% |