Indian (Asian) vs Immigrants from South Central Asia Single Father Poverty
COMPARE
Indian (Asian)
Immigrants from South Central Asia
Single Father Poverty
Single Father Poverty Comparison
Indians (Asian)
Immigrants from South Central Asia
14.8%
SINGLE FATHER POVERTY
100.0/ 100
METRIC RATING
41st/ 347
METRIC RANK
14.5%
SINGLE FATHER POVERTY
100.0/ 100
METRIC RATING
28th/ 347
METRIC RANK
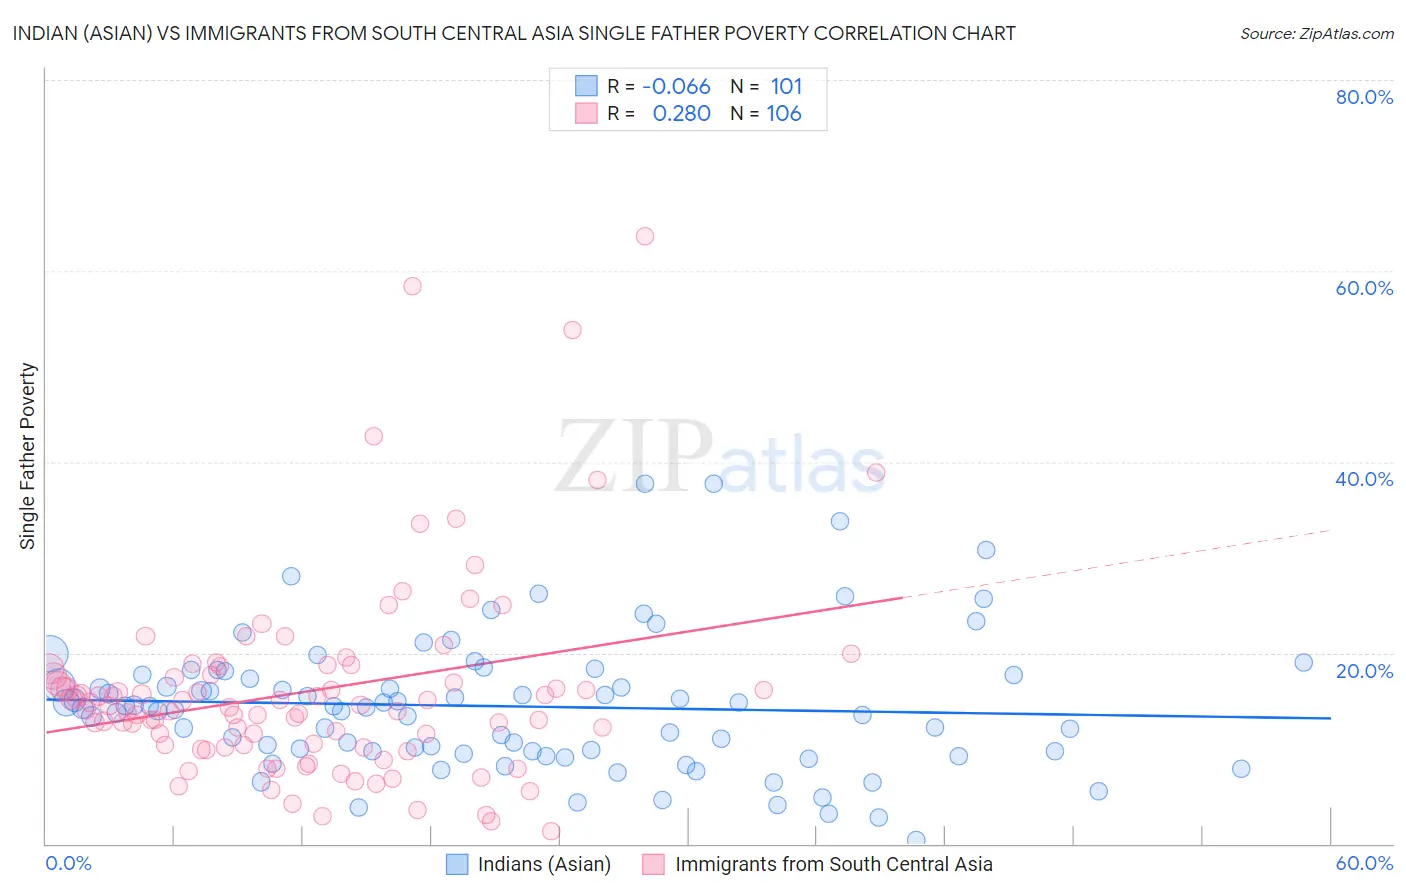
Indian (Asian) vs Immigrants from South Central Asia Single Father Poverty Correlation Chart
The statistical analysis conducted on geographies consisting of 373,368,189 people shows a slight negative correlation between the proportion of Indians (Asian) and poverty level among single fathers in the United States with a correlation coefficient (R) of -0.066 and weighted average of 14.8%. Similarly, the statistical analysis conducted on geographies consisting of 359,481,520 people shows a weak positive correlation between the proportion of Immigrants from South Central Asia and poverty level among single fathers in the United States with a correlation coefficient (R) of 0.280 and weighted average of 14.5%, a difference of 2.0%.
Single Father Poverty Correlation Summary
| Measurement | Indian (Asian) | Immigrants from South Central Asia |
| Minimum | 0.43% | 1.4% |
| Maximum | 37.7% | 63.6% |
| Range | 37.3% | 62.3% |
| Mean | 14.4% | 16.0% |
| Median | 14.2% | 14.3% |
| Interquartile 25% (IQ1) | 9.7% | 10.4% |
| Interquartile 75% (IQ3) | 17.7% | 17.7% |
| Interquartile Range (IQR) | 8.0% | 7.3% |
| Standard Deviation (Sample) | 7.1% | 10.4% |
| Standard Deviation (Population) | 7.0% | 10.4% |
Demographics Similar to Indians (Asian) and Immigrants from South Central Asia by Single Father Poverty
In terms of single father poverty, the demographic groups most similar to Indians (Asian) are Immigrants from Nepal (14.8%, a difference of 0.0%), Immigrants from Eritrea (14.8%, a difference of 0.040%), Pima (14.8%, a difference of 0.17%), Immigrants from Asia (14.7%, a difference of 0.37%), and Bolivian (14.7%, a difference of 0.54%). Similarly, the demographic groups most similar to Immigrants from South Central Asia are Somali (14.5%, a difference of 0.11%), Thai (14.5%, a difference of 0.15%), Icelander (14.5%, a difference of 0.23%), Asian (14.6%, a difference of 0.38%), and Nepalese (14.4%, a difference of 0.53%).
| Demographics | Rating | Rank | Single Father Poverty |
| Immigrants | South Eastern Asia | 100.0 /100 | #24 | Exceptional 14.4% |
| Iranians | 100.0 /100 | #25 | Exceptional 14.4% |
| Spanish American Indians | 100.0 /100 | #26 | Exceptional 14.4% |
| Nepalese | 100.0 /100 | #27 | Exceptional 14.4% |
| Immigrants | South Central Asia | 100.0 /100 | #28 | Exceptional 14.5% |
| Somalis | 100.0 /100 | #29 | Exceptional 14.5% |
| Thais | 100.0 /100 | #30 | Exceptional 14.5% |
| Icelanders | 100.0 /100 | #31 | Exceptional 14.5% |
| Asians | 100.0 /100 | #32 | Exceptional 14.6% |
| Okinawans | 100.0 /100 | #33 | Exceptional 14.6% |
| Egyptians | 100.0 /100 | #34 | Exceptional 14.7% |
| Immigrants | Bolivia | 100.0 /100 | #35 | Exceptional 14.7% |
| Immigrants | Indonesia | 100.0 /100 | #36 | Exceptional 14.7% |
| Immigrants | Eastern Africa | 100.0 /100 | #37 | Exceptional 14.7% |
| Bolivians | 100.0 /100 | #38 | Exceptional 14.7% |
| Immigrants | Asia | 100.0 /100 | #39 | Exceptional 14.7% |
| Pima | 100.0 /100 | #40 | Exceptional 14.8% |
| Indians (Asian) | 100.0 /100 | #41 | Exceptional 14.8% |
| Immigrants | Nepal | 100.0 /100 | #42 | Exceptional 14.8% |
| Immigrants | Eritrea | 100.0 /100 | #43 | Exceptional 14.8% |
| Salvadorans | 100.0 /100 | #44 | Exceptional 14.9% |