Immigrants from Zimbabwe vs Subsaharan African Child Poverty Under the Age of 5
COMPARE
Immigrants from Zimbabwe
Subsaharan African
Child Poverty Under the Age of 5
Child Poverty Under the Age of 5 Comparison
Immigrants from Zimbabwe
Sub-Saharan Africans
15.8%
CHILD POVERTY UNDER THE AGE OF 5
95.9/ 100
METRIC RATING
101st/ 347
METRIC RANK
20.8%
CHILD POVERTY UNDER THE AGE OF 5
0.0/ 100
METRIC RATING
279th/ 347
METRIC RANK
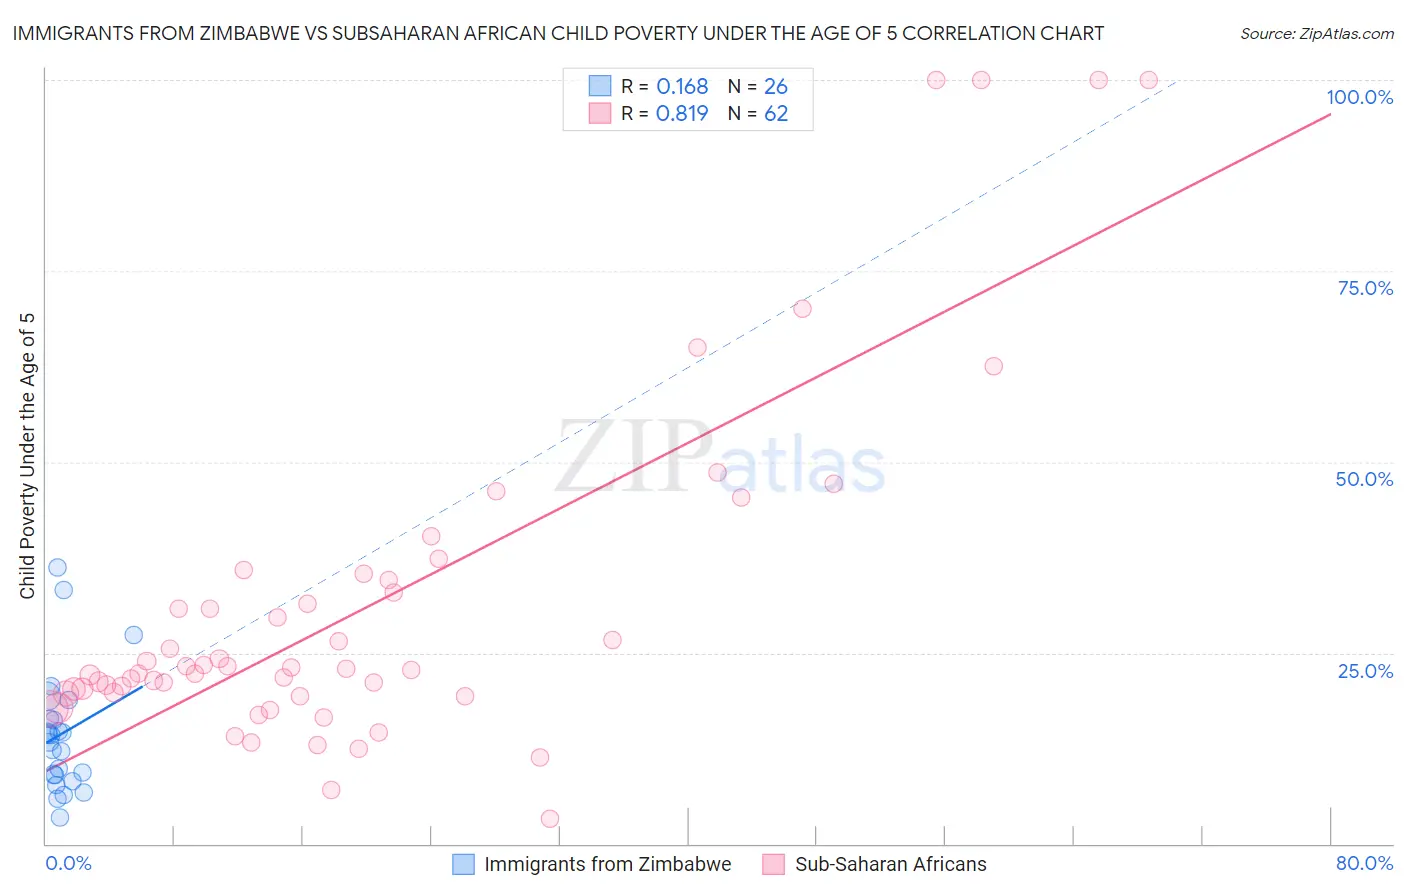
Immigrants from Zimbabwe vs Subsaharan African Child Poverty Under the Age of 5 Correlation Chart
The statistical analysis conducted on geographies consisting of 116,092,929 people shows a poor positive correlation between the proportion of Immigrants from Zimbabwe and poverty level among children under the age of 5 in the United States with a correlation coefficient (R) of 0.168 and weighted average of 15.8%. Similarly, the statistical analysis conducted on geographies consisting of 484,697,114 people shows a very strong positive correlation between the proportion of Sub-Saharan Africans and poverty level among children under the age of 5 in the United States with a correlation coefficient (R) of 0.819 and weighted average of 20.8%, a difference of 31.2%.
Child Poverty Under the Age of 5 Correlation Summary
| Measurement | Immigrants from Zimbabwe | Subsaharan African |
| Minimum | 3.4% | 3.3% |
| Maximum | 36.2% | 100.0% |
| Range | 32.8% | 96.7% |
| Mean | 14.4% | 30.9% |
| Median | 13.8% | 22.8% |
| Interquartile 25% (IQ1) | 9.1% | 19.6% |
| Interquartile 75% (IQ3) | 16.4% | 34.5% |
| Interquartile Range (IQR) | 7.4% | 14.9% |
| Standard Deviation (Sample) | 8.0% | 22.3% |
| Standard Deviation (Population) | 7.9% | 22.2% |
Similar Demographics by Child Poverty Under the Age of 5
Demographics Similar to Immigrants from Zimbabwe by Child Poverty Under the Age of 5
In terms of child poverty under the age of 5, the demographic groups most similar to Immigrants from Zimbabwe are Immigrants from Canada (15.8%, a difference of 0.010%), Palestinian (15.8%, a difference of 0.020%), Immigrants from South Africa (15.8%, a difference of 0.13%), Armenian (15.8%, a difference of 0.13%), and Macedonian (15.8%, a difference of 0.20%).
| Demographics | Rating | Rank | Child Poverty Under the Age of 5 |
| Immigrants | South Eastern Asia | 97.1 /100 | #94 | Exceptional 15.7% |
| Immigrants | Switzerland | 96.4 /100 | #95 | Exceptional 15.8% |
| Immigrants | Kazakhstan | 96.2 /100 | #96 | Exceptional 15.8% |
| Macedonians | 96.2 /100 | #97 | Exceptional 15.8% |
| Immigrants | South Africa | 96.1 /100 | #98 | Exceptional 15.8% |
| Palestinians | 95.9 /100 | #99 | Exceptional 15.8% |
| Immigrants | Canada | 95.9 /100 | #100 | Exceptional 15.8% |
| Immigrants | Zimbabwe | 95.9 /100 | #101 | Exceptional 15.8% |
| Armenians | 95.7 /100 | #102 | Exceptional 15.8% |
| Europeans | 95.3 /100 | #103 | Exceptional 15.9% |
| Immigrants | North America | 94.9 /100 | #104 | Exceptional 15.9% |
| Immigrants | Spain | 94.8 /100 | #105 | Exceptional 15.9% |
| Tlingit-Haida | 94.7 /100 | #106 | Exceptional 15.9% |
| Slovenes | 94.4 /100 | #107 | Exceptional 16.0% |
| Immigrants | Brazil | 94.4 /100 | #108 | Exceptional 16.0% |
Demographics Similar to Sub-Saharan Africans by Child Poverty Under the Age of 5
In terms of child poverty under the age of 5, the demographic groups most similar to Sub-Saharan Africans are Immigrants from Grenada (20.7%, a difference of 0.37%), Immigrants from West Indies (20.7%, a difference of 0.39%), French American Indian (20.8%, a difference of 0.41%), West Indian (20.6%, a difference of 0.56%), and Senegalese (20.9%, a difference of 0.64%).
| Demographics | Rating | Rank | Child Poverty Under the Age of 5 |
| Immigrants | Jamaica | 0.1 /100 | #272 | Tragic 20.5% |
| Central Americans | 0.1 /100 | #273 | Tragic 20.6% |
| Immigrants | Belize | 0.1 /100 | #274 | Tragic 20.6% |
| Bangladeshis | 0.1 /100 | #275 | Tragic 20.6% |
| West Indians | 0.0 /100 | #276 | Tragic 20.6% |
| Immigrants | West Indies | 0.0 /100 | #277 | Tragic 20.7% |
| Immigrants | Grenada | 0.0 /100 | #278 | Tragic 20.7% |
| Sub-Saharan Africans | 0.0 /100 | #279 | Tragic 20.8% |
| French American Indians | 0.0 /100 | #280 | Tragic 20.8% |
| Senegalese | 0.0 /100 | #281 | Tragic 20.9% |
| Potawatomi | 0.0 /100 | #282 | Tragic 21.0% |
| Comanche | 0.0 /100 | #283 | Tragic 21.0% |
| Somalis | 0.0 /100 | #284 | Tragic 21.1% |
| Haitians | 0.0 /100 | #285 | Tragic 21.2% |
| Immigrants | Latin America | 0.0 /100 | #286 | Tragic 21.2% |