Immigrants from Ethiopia vs Immigrants from Poland Poverty
COMPARE
Immigrants from Ethiopia
Immigrants from Poland
Poverty
Poverty Comparison
Immigrants from Ethiopia
Immigrants from Poland
12.2%
POVERTY
58.6/ 100
METRIC RATING
163rd/ 347
METRIC RANK
10.8%
POVERTY
99.4/ 100
METRIC RATING
34th/ 347
METRIC RANK
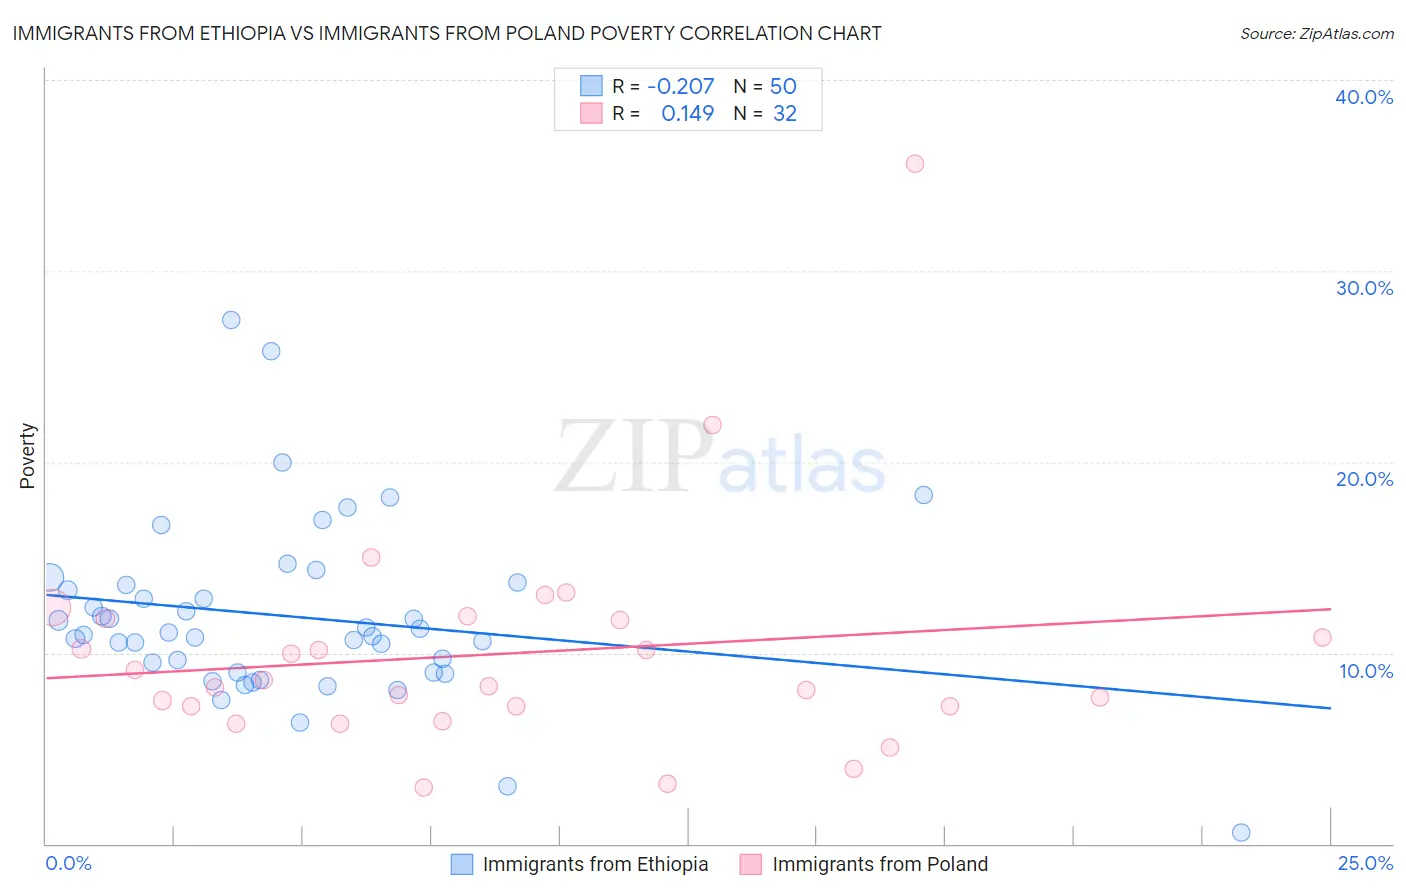
Immigrants from Ethiopia vs Immigrants from Poland Poverty Correlation Chart
The statistical analysis conducted on geographies consisting of 211,460,176 people shows a weak negative correlation between the proportion of Immigrants from Ethiopia and poverty level in the United States with a correlation coefficient (R) of -0.207 and weighted average of 12.2%. Similarly, the statistical analysis conducted on geographies consisting of 304,760,939 people shows a poor positive correlation between the proportion of Immigrants from Poland and poverty level in the United States with a correlation coefficient (R) of 0.149 and weighted average of 10.8%, a difference of 13.0%.
Poverty Correlation Summary
| Measurement | Immigrants from Ethiopia | Immigrants from Poland |
| Minimum | 0.57% | 2.9% |
| Maximum | 27.5% | 35.6% |
| Range | 26.9% | 32.7% |
| Mean | 11.9% | 10.0% |
| Median | 11.0% | 8.4% |
| Interquartile 25% (IQ1) | 9.0% | 7.2% |
| Interquartile 75% (IQ3) | 13.6% | 11.8% |
| Interquartile Range (IQR) | 4.6% | 4.6% |
| Standard Deviation (Sample) | 4.7% | 6.0% |
| Standard Deviation (Population) | 4.6% | 5.9% |
Similar Demographics by Poverty
Demographics Similar to Immigrants from Ethiopia by Poverty
In terms of poverty, the demographic groups most similar to Immigrants from Ethiopia are Ethiopian (12.2%, a difference of 0.050%), Immigrants from Fiji (12.2%, a difference of 0.060%), Colombian (12.2%, a difference of 0.070%), Immigrants from Albania (12.2%, a difference of 0.080%), and Venezuelan (12.2%, a difference of 0.17%).
| Demographics | Rating | Rank | Poverty |
| Scotch-Irish | 62.6 /100 | #156 | Good 12.2% |
| Costa Ricans | 62.2 /100 | #157 | Good 12.2% |
| Taiwanese | 61.8 /100 | #158 | Good 12.2% |
| Pennsylvania Germans | 60.8 /100 | #159 | Good 12.2% |
| Immigrants | Nepal | 60.4 /100 | #160 | Good 12.2% |
| Immigrants | Fiji | 59.1 /100 | #161 | Average 12.2% |
| Ethiopians | 59.1 /100 | #162 | Average 12.2% |
| Immigrants | Ethiopia | 58.6 /100 | #163 | Average 12.2% |
| Colombians | 57.8 /100 | #164 | Average 12.2% |
| Immigrants | Albania | 57.7 /100 | #165 | Average 12.2% |
| Venezuelans | 56.9 /100 | #166 | Average 12.2% |
| Immigrants | Chile | 56.7 /100 | #167 | Average 12.2% |
| Immigrants | Venezuela | 56.5 /100 | #168 | Average 12.2% |
| Whites/Caucasians | 55.4 /100 | #169 | Average 12.3% |
| Immigrants | Oceania | 54.6 /100 | #170 | Average 12.3% |
Demographics Similar to Immigrants from Poland by Poverty
In terms of poverty, the demographic groups most similar to Immigrants from Poland are Tongan (10.8%, a difference of 0.040%), Macedonian (10.8%, a difference of 0.090%), Cypriot (10.8%, a difference of 0.12%), Immigrants from Greece (10.8%, a difference of 0.22%), and Czech (10.8%, a difference of 0.26%).
| Demographics | Rating | Rank | Poverty |
| Immigrants | Northern Europe | 99.6 /100 | #27 | Exceptional 10.7% |
| Immigrants | Korea | 99.5 /100 | #28 | Exceptional 10.7% |
| Greeks | 99.5 /100 | #29 | Exceptional 10.7% |
| Danes | 99.5 /100 | #30 | Exceptional 10.7% |
| Poles | 99.5 /100 | #31 | Exceptional 10.7% |
| Iranians | 99.5 /100 | #32 | Exceptional 10.7% |
| Macedonians | 99.4 /100 | #33 | Exceptional 10.8% |
| Immigrants | Poland | 99.4 /100 | #34 | Exceptional 10.8% |
| Tongans | 99.4 /100 | #35 | Exceptional 10.8% |
| Cypriots | 99.3 /100 | #36 | Exceptional 10.8% |
| Immigrants | Greece | 99.3 /100 | #37 | Exceptional 10.8% |
| Czechs | 99.3 /100 | #38 | Exceptional 10.8% |
| Immigrants | Pakistan | 99.3 /100 | #39 | Exceptional 10.8% |
| Russians | 99.3 /100 | #40 | Exceptional 10.9% |
| Immigrants | Iran | 99.2 /100 | #41 | Exceptional 10.9% |