Immigrants from Zaire vs Bulgarian Male Poverty
COMPARE
Immigrants from Zaire
Bulgarian
Male Poverty
Male Poverty Comparison
Immigrants from Zaire
Bulgarians
13.8%
MALE POVERTY
0.0/ 100
METRIC RATING
290th/ 347
METRIC RANK
9.3%
MALE POVERTY
99.9/ 100
METRIC RATING
10th/ 347
METRIC RANK
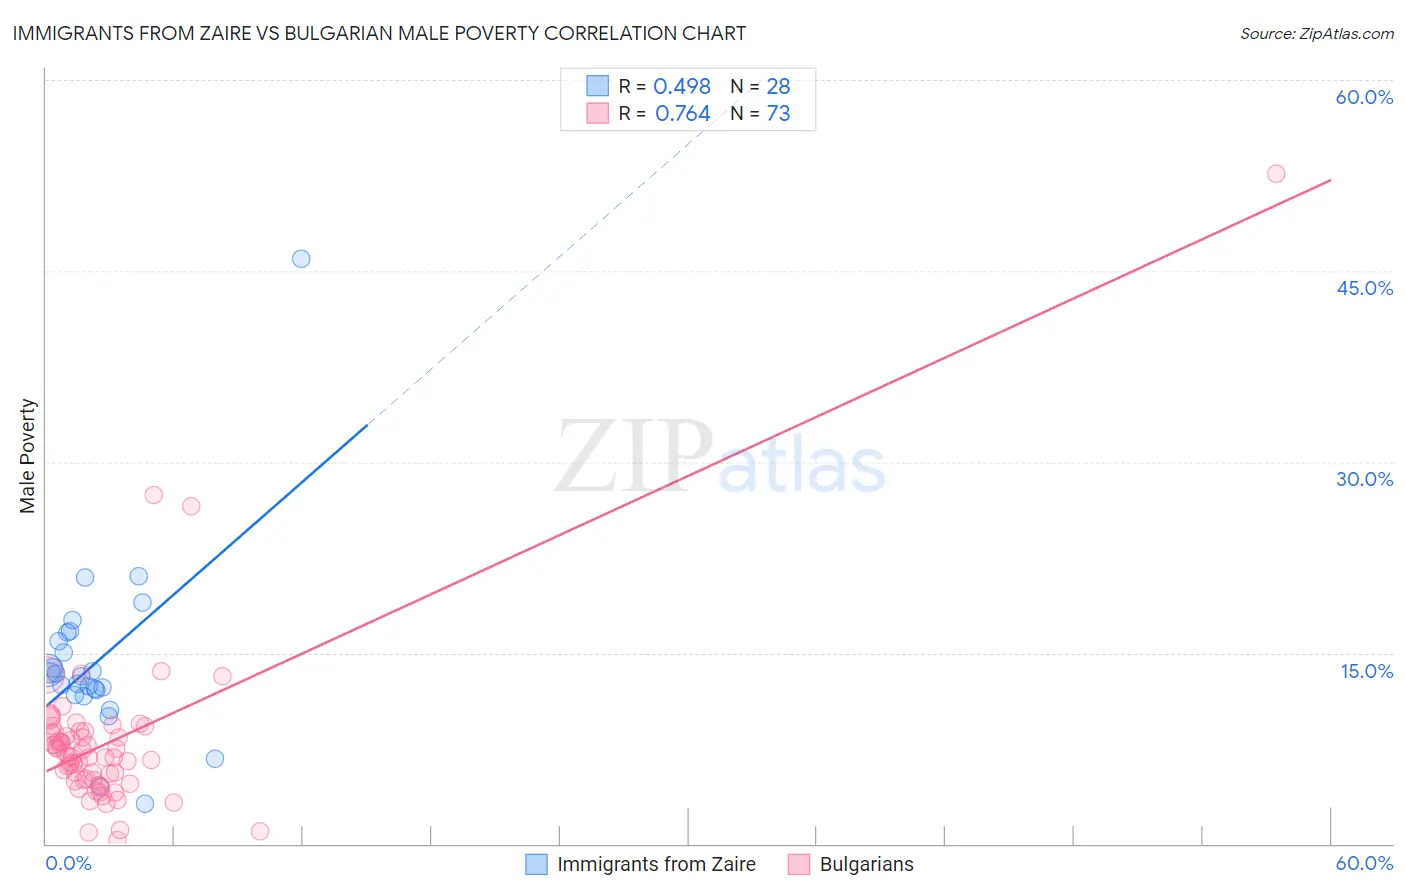
Immigrants from Zaire vs Bulgarian Male Poverty Correlation Chart
The statistical analysis conducted on geographies consisting of 107,236,252 people shows a moderate positive correlation between the proportion of Immigrants from Zaire and poverty level among males in the United States with a correlation coefficient (R) of 0.498 and weighted average of 13.8%. Similarly, the statistical analysis conducted on geographies consisting of 205,546,988 people shows a strong positive correlation between the proportion of Bulgarians and poverty level among males in the United States with a correlation coefficient (R) of 0.764 and weighted average of 9.3%, a difference of 48.1%.
Male Poverty Correlation Summary
| Measurement | Immigrants from Zaire | Bulgarian |
| Minimum | 3.1% | 0.33% |
| Maximum | 45.9% | 52.6% |
| Range | 42.8% | 52.3% |
| Mean | 14.3% | 8.0% |
| Median | 13.3% | 6.8% |
| Interquartile 25% (IQ1) | 11.9% | 5.0% |
| Interquartile 75% (IQ3) | 16.3% | 8.8% |
| Interquartile Range (IQR) | 4.4% | 3.8% |
| Standard Deviation (Sample) | 7.4% | 6.8% |
| Standard Deviation (Population) | 7.3% | 6.8% |
Similar Demographics by Male Poverty
Demographics Similar to Immigrants from Zaire by Male Poverty
In terms of male poverty, the demographic groups most similar to Immigrants from Zaire are Guatemalan (13.8%, a difference of 0.010%), Vietnamese (13.8%, a difference of 0.090%), Immigrants from St. Vincent and the Grenadines (13.8%, a difference of 0.18%), Indonesian (13.8%, a difference of 0.26%), and Immigrants from Belize (13.8%, a difference of 0.27%).
| Demographics | Rating | Rank | Male Poverty |
| Comanche | 0.0 /100 | #283 | Tragic 13.8% |
| Immigrants | Haiti | 0.0 /100 | #284 | Tragic 13.8% |
| West Indians | 0.0 /100 | #285 | Tragic 13.8% |
| Shoshone | 0.0 /100 | #286 | Tragic 13.8% |
| Immigrants | Barbados | 0.0 /100 | #287 | Tragic 13.8% |
| Immigrants | St. Vincent and the Grenadines | 0.0 /100 | #288 | Tragic 13.8% |
| Guatemalans | 0.0 /100 | #289 | Tragic 13.8% |
| Immigrants | Zaire | 0.0 /100 | #290 | Tragic 13.8% |
| Vietnamese | 0.0 /100 | #291 | Tragic 13.8% |
| Indonesians | 0.0 /100 | #292 | Tragic 13.8% |
| Immigrants | Belize | 0.0 /100 | #293 | Tragic 13.8% |
| Hispanics or Latinos | 0.0 /100 | #294 | Tragic 13.9% |
| Immigrants | Central America | 0.0 /100 | #295 | Tragic 13.9% |
| Cajuns | 0.0 /100 | #296 | Tragic 13.9% |
| Inupiat | 0.0 /100 | #297 | Tragic 14.0% |
Demographics Similar to Bulgarians by Male Poverty
In terms of male poverty, the demographic groups most similar to Bulgarians are Immigrants from South Central Asia (9.3%, a difference of 0.56%), Bolivian (9.4%, a difference of 0.64%), Immigrants from Bolivia (9.4%, a difference of 0.69%), Immigrants from Lithuania (9.4%, a difference of 0.82%), and Immigrants from North Macedonia (9.4%, a difference of 1.2%).
| Demographics | Rating | Rank | Male Poverty |
| Thais | 100.0 /100 | #3 | Exceptional 8.7% |
| Immigrants | Taiwan | 100.0 /100 | #4 | Exceptional 8.9% |
| Maltese | 100.0 /100 | #5 | Exceptional 9.1% |
| Assyrians/Chaldeans/Syriacs | 99.9 /100 | #6 | Exceptional 9.1% |
| Immigrants | Ireland | 99.9 /100 | #7 | Exceptional 9.1% |
| Filipinos | 99.9 /100 | #8 | Exceptional 9.2% |
| Immigrants | South Central Asia | 99.9 /100 | #9 | Exceptional 9.3% |
| Bulgarians | 99.9 /100 | #10 | Exceptional 9.3% |
| Bolivians | 99.9 /100 | #11 | Exceptional 9.4% |
| Immigrants | Bolivia | 99.9 /100 | #12 | Exceptional 9.4% |
| Immigrants | Lithuania | 99.9 /100 | #13 | Exceptional 9.4% |
| Immigrants | North Macedonia | 99.8 /100 | #14 | Exceptional 9.4% |
| Bhutanese | 99.8 /100 | #15 | Exceptional 9.5% |
| Luxembourgers | 99.8 /100 | #16 | Exceptional 9.5% |
| Norwegians | 99.8 /100 | #17 | Exceptional 9.5% |