Nigerian vs Bulgarian Male Poverty
COMPARE
Nigerian
Bulgarian
Male Poverty
Male Poverty Comparison
Nigerians
Bulgarians
12.3%
MALE POVERTY
1.4/ 100
METRIC RATING
226th/ 347
METRIC RANK
9.3%
MALE POVERTY
99.9/ 100
METRIC RATING
10th/ 347
METRIC RANK
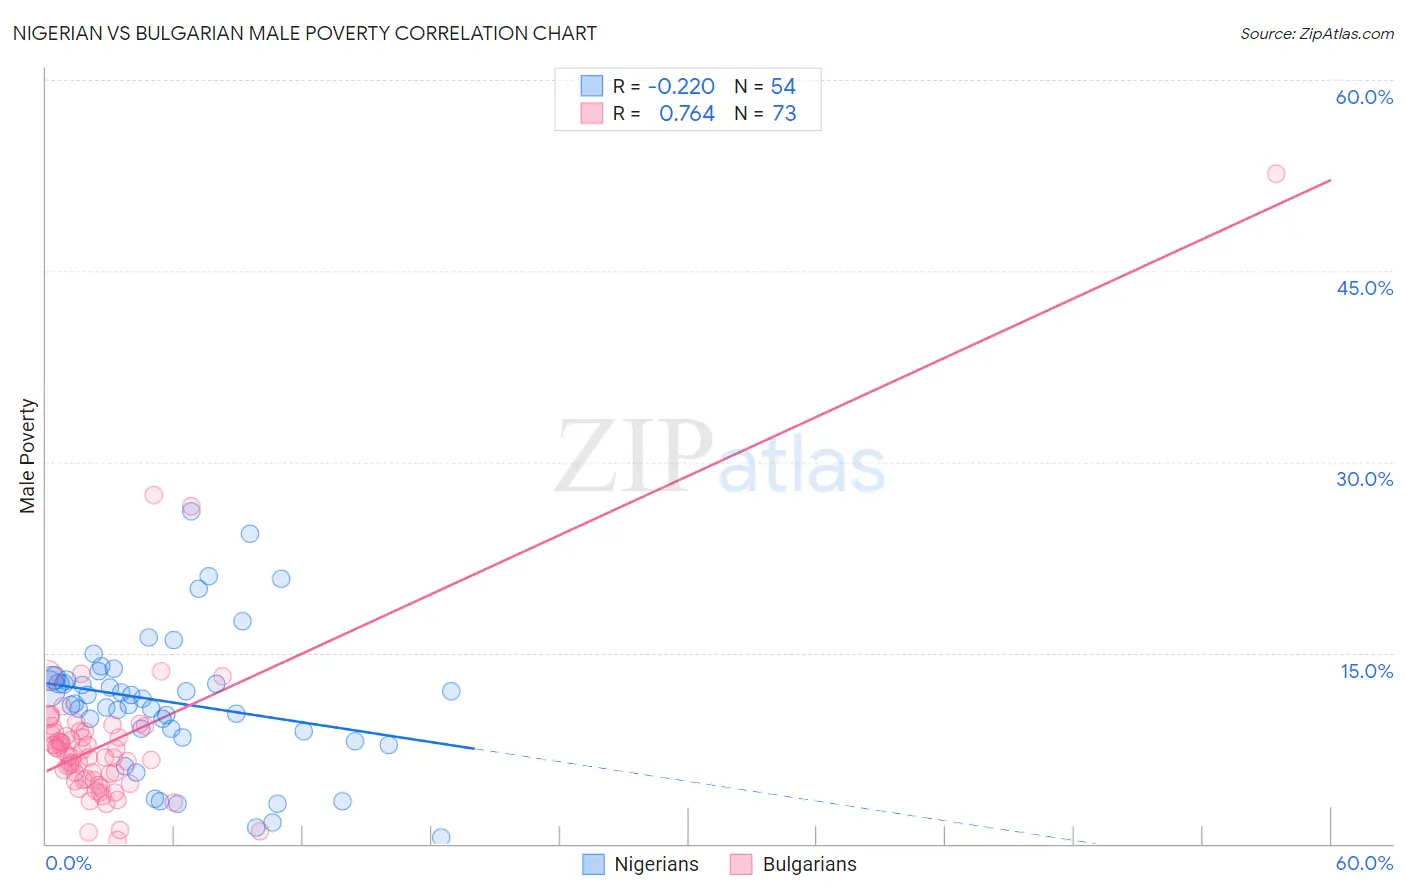
Nigerian vs Bulgarian Male Poverty Correlation Chart
The statistical analysis conducted on geographies consisting of 332,422,951 people shows a weak negative correlation between the proportion of Nigerians and poverty level among males in the United States with a correlation coefficient (R) of -0.220 and weighted average of 12.3%. Similarly, the statistical analysis conducted on geographies consisting of 205,546,988 people shows a strong positive correlation between the proportion of Bulgarians and poverty level among males in the United States with a correlation coefficient (R) of 0.764 and weighted average of 9.3%, a difference of 32.4%.
Male Poverty Correlation Summary
| Measurement | Nigerian | Bulgarian |
| Minimum | 0.49% | 0.33% |
| Maximum | 26.1% | 52.6% |
| Range | 25.6% | 52.3% |
| Mean | 11.1% | 8.0% |
| Median | 11.2% | 6.8% |
| Interquartile 25% (IQ1) | 8.9% | 5.0% |
| Interquartile 75% (IQ3) | 13.0% | 8.8% |
| Interquartile Range (IQR) | 4.1% | 3.8% |
| Standard Deviation (Sample) | 5.4% | 6.8% |
| Standard Deviation (Population) | 5.3% | 6.8% |
Similar Demographics by Male Poverty
Demographics Similar to Nigerians by Male Poverty
In terms of male poverty, the demographic groups most similar to Nigerians are Alaska Native (12.4%, a difference of 0.090%), Alsatian (12.4%, a difference of 0.13%), Osage (12.3%, a difference of 0.17%), Immigrants from Nigeria (12.3%, a difference of 0.22%), and Cuban (12.4%, a difference of 0.23%).
| Demographics | Rating | Rank | Male Poverty |
| Bermudans | 2.4 /100 | #219 | Tragic 12.2% |
| Immigrants | Eritrea | 2.4 /100 | #220 | Tragic 12.2% |
| Ugandans | 2.2 /100 | #221 | Tragic 12.2% |
| Immigrants | Africa | 2.1 /100 | #222 | Tragic 12.2% |
| Immigrants | Micronesia | 2.1 /100 | #223 | Tragic 12.2% |
| Immigrants | Nigeria | 1.6 /100 | #224 | Tragic 12.3% |
| Osage | 1.5 /100 | #225 | Tragic 12.3% |
| Nigerians | 1.4 /100 | #226 | Tragic 12.3% |
| Alaska Natives | 1.4 /100 | #227 | Tragic 12.4% |
| Alsatians | 1.3 /100 | #228 | Tragic 12.4% |
| Cubans | 1.3 /100 | #229 | Tragic 12.4% |
| Marshallese | 0.8 /100 | #230 | Tragic 12.5% |
| Salvadorans | 0.6 /100 | #231 | Tragic 12.6% |
| Nicaraguans | 0.6 /100 | #232 | Tragic 12.6% |
| Fijians | 0.6 /100 | #233 | Tragic 12.6% |
Demographics Similar to Bulgarians by Male Poverty
In terms of male poverty, the demographic groups most similar to Bulgarians are Immigrants from South Central Asia (9.3%, a difference of 0.56%), Bolivian (9.4%, a difference of 0.64%), Immigrants from Bolivia (9.4%, a difference of 0.69%), Immigrants from Lithuania (9.4%, a difference of 0.82%), and Immigrants from North Macedonia (9.4%, a difference of 1.2%).
| Demographics | Rating | Rank | Male Poverty |
| Thais | 100.0 /100 | #3 | Exceptional 8.7% |
| Immigrants | Taiwan | 100.0 /100 | #4 | Exceptional 8.9% |
| Maltese | 100.0 /100 | #5 | Exceptional 9.1% |
| Assyrians/Chaldeans/Syriacs | 99.9 /100 | #6 | Exceptional 9.1% |
| Immigrants | Ireland | 99.9 /100 | #7 | Exceptional 9.1% |
| Filipinos | 99.9 /100 | #8 | Exceptional 9.2% |
| Immigrants | South Central Asia | 99.9 /100 | #9 | Exceptional 9.3% |
| Bulgarians | 99.9 /100 | #10 | Exceptional 9.3% |
| Bolivians | 99.9 /100 | #11 | Exceptional 9.4% |
| Immigrants | Bolivia | 99.9 /100 | #12 | Exceptional 9.4% |
| Immigrants | Lithuania | 99.9 /100 | #13 | Exceptional 9.4% |
| Immigrants | North Macedonia | 99.8 /100 | #14 | Exceptional 9.4% |
| Bhutanese | 99.8 /100 | #15 | Exceptional 9.5% |
| Luxembourgers | 99.8 /100 | #16 | Exceptional 9.5% |
| Norwegians | 99.8 /100 | #17 | Exceptional 9.5% |