British vs Scotch-Irish Child Poverty Among Boys Under 16
COMPARE
British
Scotch-Irish
Child Poverty Among Boys Under 16
Child Poverty Among Boys Under 16 Comparison
British
Scotch-Irish
15.0%
CHILD POVERTY AMONG BOYS UNDER 16
96.2/ 100
METRIC RATING
98th/ 347
METRIC RANK
16.5%
CHILD POVERTY AMONG BOYS UNDER 16
47.5/ 100
METRIC RATING
178th/ 347
METRIC RANK
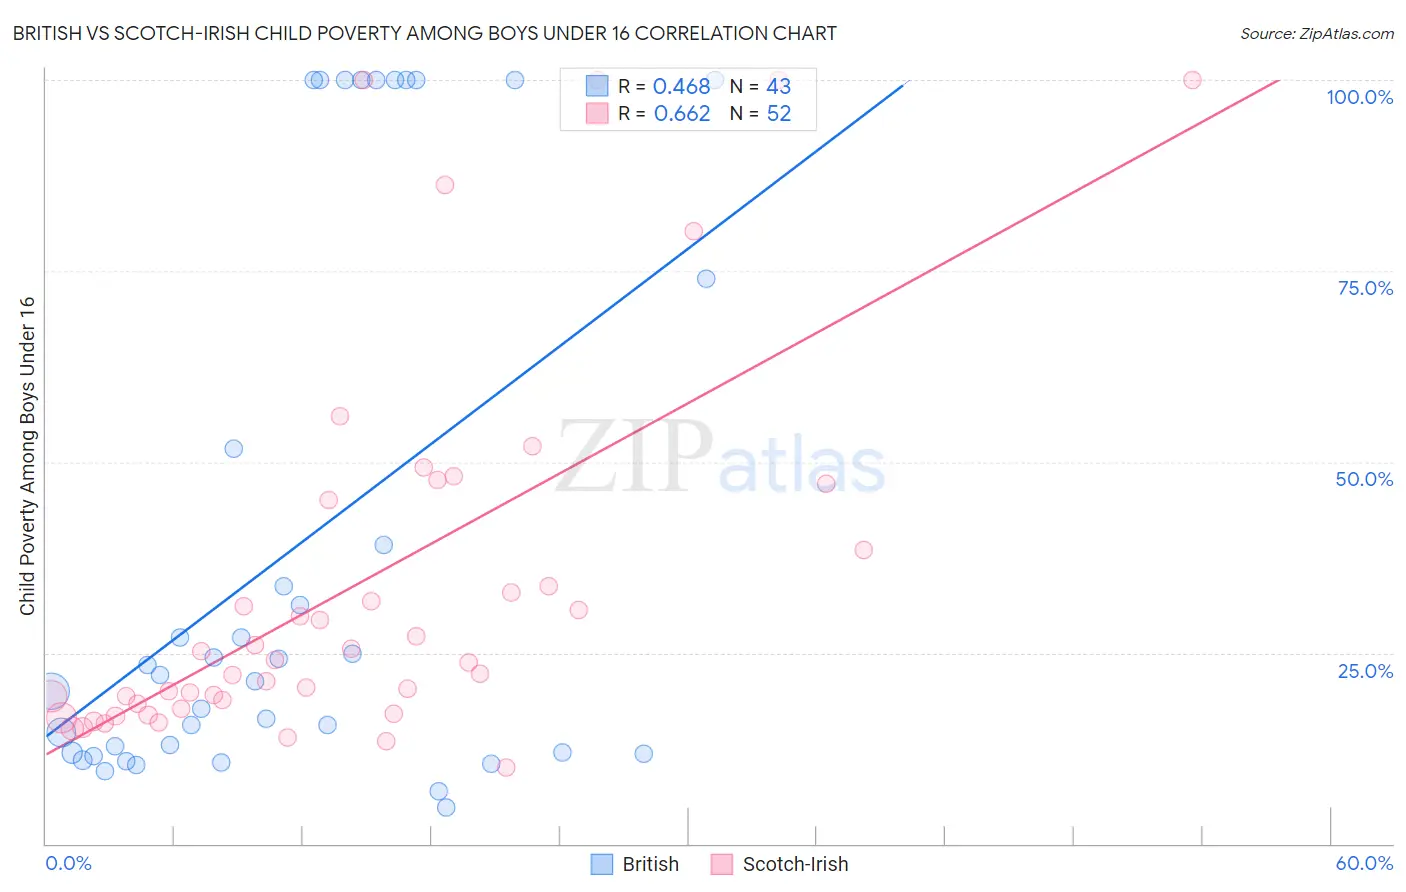
British vs Scotch-Irish Child Poverty Among Boys Under 16 Correlation Chart
The statistical analysis conducted on geographies consisting of 515,985,739 people shows a moderate positive correlation between the proportion of British and poverty level among boys under the age of 16 in the United States with a correlation coefficient (R) of 0.468 and weighted average of 15.0%. Similarly, the statistical analysis conducted on geographies consisting of 530,822,758 people shows a significant positive correlation between the proportion of Scotch-Irish and poverty level among boys under the age of 16 in the United States with a correlation coefficient (R) of 0.662 and weighted average of 16.5%, a difference of 10.2%.
Child Poverty Among Boys Under 16 Correlation Summary
| Measurement | British | Scotch-Irish |
| Minimum | 4.7% | 10.0% |
| Maximum | 100.0% | 100.0% |
| Range | 95.3% | 90.0% |
| Mean | 38.9% | 33.9% |
| Median | 22.1% | 23.9% |
| Interquartile 25% (IQ1) | 11.9% | 18.0% |
| Interquartile 75% (IQ3) | 73.9% | 41.8% |
| Interquartile Range (IQR) | 62.0% | 23.8% |
| Standard Deviation (Sample) | 36.2% | 24.8% |
| Standard Deviation (Population) | 35.7% | 24.6% |
Similar Demographics by Child Poverty Among Boys Under 16
Demographics Similar to British by Child Poverty Among Boys Under 16
In terms of child poverty among boys under 16, the demographic groups most similar to British are Immigrants from Egypt (14.9%, a difference of 0.040%), Immigrants from North Macedonia (14.9%, a difference of 0.050%), Immigrants from France (15.0%, a difference of 0.090%), Finnish (14.9%, a difference of 0.31%), and Chilean (15.0%, a difference of 0.33%).
| Demographics | Rating | Rank | Child Poverty Among Boys Under 16 |
| Paraguayans | 96.8 /100 | #91 | Exceptional 14.9% |
| Argentineans | 96.7 /100 | #92 | Exceptional 14.9% |
| Sri Lankans | 96.7 /100 | #93 | Exceptional 14.9% |
| Immigrants | Italy | 96.7 /100 | #94 | Exceptional 14.9% |
| Finns | 96.5 /100 | #95 | Exceptional 14.9% |
| Immigrants | North Macedonia | 96.3 /100 | #96 | Exceptional 14.9% |
| Immigrants | Egypt | 96.2 /100 | #97 | Exceptional 14.9% |
| British | 96.2 /100 | #98 | Exceptional 15.0% |
| Immigrants | France | 96.1 /100 | #99 | Exceptional 15.0% |
| Chileans | 95.8 /100 | #100 | Exceptional 15.0% |
| Immigrants | Belarus | 95.7 /100 | #101 | Exceptional 15.0% |
| Romanians | 95.6 /100 | #102 | Exceptional 15.0% |
| Immigrants | Denmark | 95.6 /100 | #103 | Exceptional 15.0% |
| Immigrants | Switzerland | 95.4 /100 | #104 | Exceptional 15.0% |
| Dutch | 95.4 /100 | #105 | Exceptional 15.0% |
Demographics Similar to Scotch-Irish by Child Poverty Among Boys Under 16
In terms of child poverty among boys under 16, the demographic groups most similar to Scotch-Irish are Hungarian (16.5%, a difference of 0.020%), Ethiopian (16.5%, a difference of 0.040%), White/Caucasian (16.5%, a difference of 0.080%), Immigrants from Syria (16.5%, a difference of 0.17%), and Hawaiian (16.5%, a difference of 0.22%).
| Demographics | Rating | Rank | Child Poverty Among Boys Under 16 |
| Immigrants | Ethiopia | 51.3 /100 | #171 | Average 16.4% |
| Immigrants | Colombia | 50.8 /100 | #172 | Average 16.4% |
| Tsimshian | 50.5 /100 | #173 | Average 16.4% |
| Uruguayans | 50.0 /100 | #174 | Average 16.4% |
| Immigrants | Syria | 49.0 /100 | #175 | Average 16.5% |
| Whites/Caucasians | 48.2 /100 | #176 | Average 16.5% |
| Ethiopians | 47.8 /100 | #177 | Average 16.5% |
| Scotch-Irish | 47.5 /100 | #178 | Average 16.5% |
| Hungarians | 47.3 /100 | #179 | Average 16.5% |
| Hawaiians | 45.5 /100 | #180 | Average 16.5% |
| South American Indians | 44.3 /100 | #181 | Average 16.5% |
| Lebanese | 43.3 /100 | #182 | Average 16.6% |
| Kenyans | 41.0 /100 | #183 | Average 16.6% |
| Celtics | 40.6 /100 | #184 | Average 16.6% |
| Immigrants | Western Asia | 40.4 /100 | #185 | Average 16.6% |