Immigrants from Western Asia vs Belgian Unemployment Among Ages 20 to 24 years
COMPARE
Immigrants from Western Asia
Belgian
Unemployment Among Ages 20 to 24 years
Unemployment Among Ages 20 to 24 years Comparison
Immigrants from Western Asia
Belgians
10.9%
UNEMPLOYMENT AMONG AGES 20 TO 24 YEARS
0.3/ 100
METRIC RATING
257th/ 347
METRIC RANK
9.6%
UNEMPLOYMENT AMONG AGES 20 TO 24 YEARS
100.0/ 100
METRIC RATING
36th/ 347
METRIC RANK
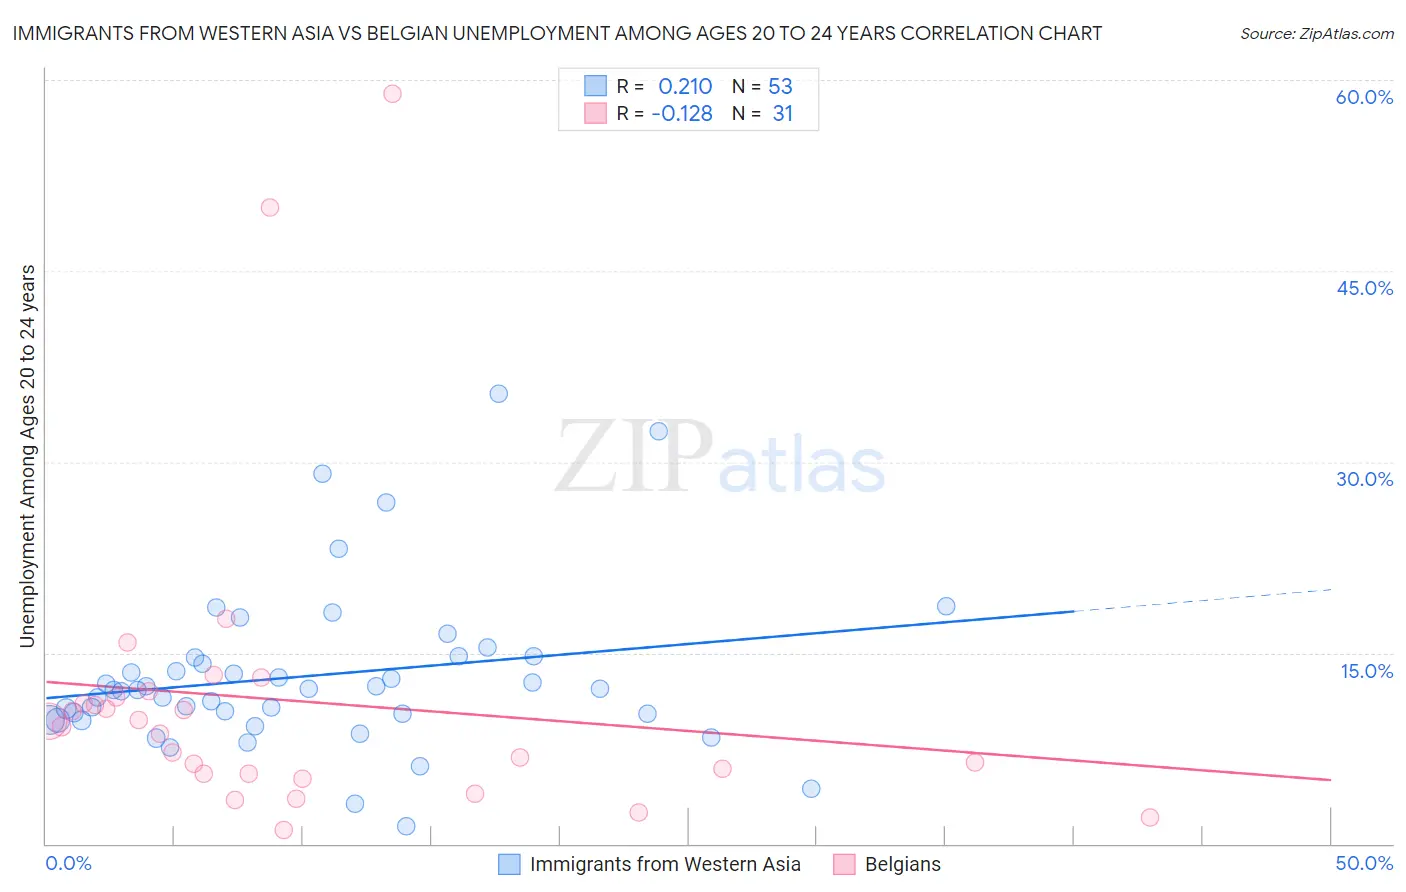
Immigrants from Western Asia vs Belgian Unemployment Among Ages 20 to 24 years Correlation Chart
The statistical analysis conducted on geographies consisting of 393,132,982 people shows a weak positive correlation between the proportion of Immigrants from Western Asia and unemployment rate among population between the ages 20 and 24 in the United States with a correlation coefficient (R) of 0.210 and weighted average of 10.9%. Similarly, the statistical analysis conducted on geographies consisting of 342,879,966 people shows a poor negative correlation between the proportion of Belgians and unemployment rate among population between the ages 20 and 24 in the United States with a correlation coefficient (R) of -0.128 and weighted average of 9.6%, a difference of 13.4%.
Unemployment Among Ages 20 to 24 years Correlation Summary
| Measurement | Immigrants from Western Asia | Belgian |
| Minimum | 1.4% | 1.1% |
| Maximum | 35.4% | 58.9% |
| Range | 34.0% | 57.8% |
| Mean | 13.2% | 11.2% |
| Median | 12.1% | 9.2% |
| Interquartile 25% (IQ1) | 10.0% | 5.5% |
| Interquartile 75% (IQ3) | 14.6% | 11.5% |
| Interquartile Range (IQR) | 4.7% | 6.0% |
| Standard Deviation (Sample) | 6.4% | 12.3% |
| Standard Deviation (Population) | 6.4% | 12.1% |
Similar Demographics by Unemployment Among Ages 20 to 24 years
Demographics Similar to Immigrants from Western Asia by Unemployment Among Ages 20 to 24 years
In terms of unemployment among ages 20 to 24 years, the demographic groups most similar to Immigrants from Western Asia are Immigrants from Bahamas (10.9%, a difference of 0.070%), Dutch West Indian (10.9%, a difference of 0.070%), Liberian (10.8%, a difference of 0.17%), Immigrants from Israel (10.8%, a difference of 0.17%), and Panamanian (10.9%, a difference of 0.17%).
| Demographics | Rating | Rank | Unemployment Among Ages 20 to 24 years |
| Albanians | 0.5 /100 | #250 | Tragic 10.8% |
| Immigrants | Panama | 0.4 /100 | #251 | Tragic 10.8% |
| Immigrants | Syria | 0.4 /100 | #252 | Tragic 10.8% |
| Spanish Americans | 0.4 /100 | #253 | Tragic 10.8% |
| Liberians | 0.3 /100 | #254 | Tragic 10.8% |
| Immigrants | Israel | 0.3 /100 | #255 | Tragic 10.8% |
| Immigrants | Bahamas | 0.3 /100 | #256 | Tragic 10.9% |
| Immigrants | Western Asia | 0.3 /100 | #257 | Tragic 10.9% |
| Dutch West Indians | 0.3 /100 | #258 | Tragic 10.9% |
| Panamanians | 0.2 /100 | #259 | Tragic 10.9% |
| Immigrants | Lebanon | 0.2 /100 | #260 | Tragic 10.9% |
| Puget Sound Salish | 0.2 /100 | #261 | Tragic 10.9% |
| Immigrants | Latin America | 0.1 /100 | #262 | Tragic 11.0% |
| Marshallese | 0.1 /100 | #263 | Tragic 11.0% |
| Sub-Saharan Africans | 0.0 /100 | #264 | Tragic 11.1% |
Demographics Similar to Belgians by Unemployment Among Ages 20 to 24 years
In terms of unemployment among ages 20 to 24 years, the demographic groups most similar to Belgians are German (9.6%, a difference of 0.030%), Immigrants from Zaire (9.6%, a difference of 0.080%), Yugoslavian (9.6%, a difference of 0.11%), Afghan (9.6%, a difference of 0.15%), and Australian (9.6%, a difference of 0.31%).
| Demographics | Rating | Rank | Unemployment Among Ages 20 to 24 years |
| Immigrants | North Macedonia | 100.0 /100 | #29 | Exceptional 9.5% |
| Scandinavians | 100.0 /100 | #30 | Exceptional 9.5% |
| Immigrants | Eastern Africa | 100.0 /100 | #31 | Exceptional 9.5% |
| Cambodians | 100.0 /100 | #32 | Exceptional 9.5% |
| Australians | 100.0 /100 | #33 | Exceptional 9.6% |
| Yugoslavians | 100.0 /100 | #34 | Exceptional 9.6% |
| Germans | 100.0 /100 | #35 | Exceptional 9.6% |
| Belgians | 100.0 /100 | #36 | Exceptional 9.6% |
| Immigrants | Zaire | 100.0 /100 | #37 | Exceptional 9.6% |
| Afghans | 99.9 /100 | #38 | Exceptional 9.6% |
| Dutch | 99.9 /100 | #39 | Exceptional 9.6% |
| Immigrants | Ethiopia | 99.9 /100 | #40 | Exceptional 9.6% |
| Swiss | 99.9 /100 | #41 | Exceptional 9.7% |
| Immigrants | Saudi Arabia | 99.9 /100 | #42 | Exceptional 9.7% |
| Menominee | 99.8 /100 | #43 | Exceptional 9.7% |