Immigrants from West Indies vs Austrian Female Poverty Among 18-24 Year Olds
COMPARE
Immigrants from West Indies
Austrian
Female Poverty Among 18-24 Year Olds
Female Poverty Among 18-24 Year Olds Comparison
Immigrants from West Indies
Austrians
21.0%
FEMALE POVERTY AMONG 18-24 YEAR OLDS
2.2/ 100
METRIC RATING
250th/ 347
METRIC RANK
19.5%
FEMALE POVERTY AMONG 18-24 YEAR OLDS
90.7/ 100
METRIC RATING
137th/ 347
METRIC RANK
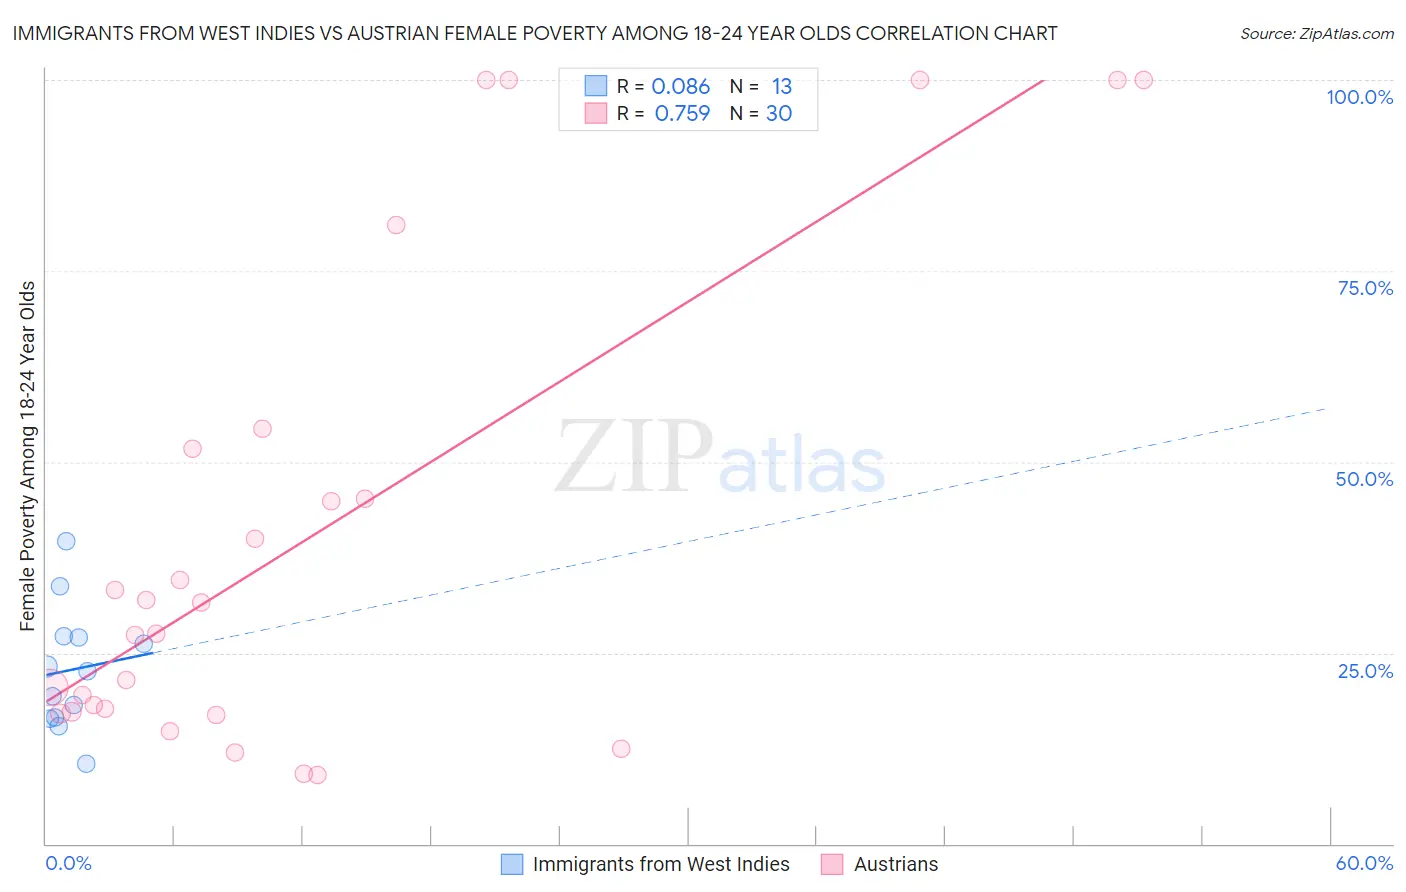
Immigrants from West Indies vs Austrian Female Poverty Among 18-24 Year Olds Correlation Chart
The statistical analysis conducted on geographies consisting of 72,177,510 people shows a slight positive correlation between the proportion of Immigrants from West Indies and poverty level among females between the ages 18 and 24 in the United States with a correlation coefficient (R) of 0.086 and weighted average of 21.0%. Similarly, the statistical analysis conducted on geographies consisting of 434,794,519 people shows a strong positive correlation between the proportion of Austrians and poverty level among females between the ages 18 and 24 in the United States with a correlation coefficient (R) of 0.759 and weighted average of 19.5%, a difference of 7.6%.
Female Poverty Among 18-24 Year Olds Correlation Summary
| Measurement | Immigrants from West Indies | Austrian |
| Minimum | 10.5% | 9.1% |
| Maximum | 39.6% | 100.0% |
| Range | 29.2% | 90.9% |
| Mean | 22.8% | 40.3% |
| Median | 22.6% | 29.5% |
| Interquartile 25% (IQ1) | 16.5% | 17.3% |
| Interquartile 75% (IQ3) | 27.1% | 51.8% |
| Interquartile Range (IQR) | 10.6% | 34.5% |
| Standard Deviation (Sample) | 8.0% | 31.3% |
| Standard Deviation (Population) | 7.7% | 30.8% |
Similar Demographics by Female Poverty Among 18-24 Year Olds
Demographics Similar to Immigrants from West Indies by Female Poverty Among 18-24 Year Olds
In terms of female poverty among 18-24 year olds, the demographic groups most similar to Immigrants from West Indies are Carpatho Rusyn (21.0%, a difference of 0.13%), Immigrants from Kenya (21.0%, a difference of 0.15%), West Indian (21.1%, a difference of 0.20%), Immigrants from Africa (21.0%, a difference of 0.35%), and South African (21.1%, a difference of 0.38%).
| Demographics | Rating | Rank | Female Poverty Among 18-24 Year Olds |
| Marshallese | 3.4 /100 | #243 | Tragic 20.9% |
| Immigrants | Thailand | 3.4 /100 | #244 | Tragic 20.9% |
| Aleuts | 3.3 /100 | #245 | Tragic 20.9% |
| Immigrants | Australia | 3.1 /100 | #246 | Tragic 20.9% |
| Immigrants | Africa | 3.0 /100 | #247 | Tragic 21.0% |
| Immigrants | Kenya | 2.5 /100 | #248 | Tragic 21.0% |
| Carpatho Rusyns | 2.5 /100 | #249 | Tragic 21.0% |
| Immigrants | West Indies | 2.2 /100 | #250 | Tragic 21.0% |
| West Indians | 1.9 /100 | #251 | Tragic 21.1% |
| South Africans | 1.6 /100 | #252 | Tragic 21.1% |
| Delaware | 1.6 /100 | #253 | Tragic 21.1% |
| British West Indians | 1.2 /100 | #254 | Tragic 21.2% |
| Immigrants | Grenada | 1.2 /100 | #255 | Tragic 21.2% |
| Tsimshian | 1.0 /100 | #256 | Tragic 21.2% |
| Taiwanese | 1.0 /100 | #257 | Tragic 21.2% |
Demographics Similar to Austrians by Female Poverty Among 18-24 Year Olds
In terms of female poverty among 18-24 year olds, the demographic groups most similar to Austrians are Russian (19.5%, a difference of 0.12%), Immigrants from Morocco (19.6%, a difference of 0.12%), Soviet Union (19.5%, a difference of 0.21%), Jamaican (19.5%, a difference of 0.23%), and Turkish (19.5%, a difference of 0.23%).
| Demographics | Rating | Rank | Female Poverty Among 18-24 Year Olds |
| Immigrants | Canada | 92.9 /100 | #130 | Exceptional 19.5% |
| Latvians | 92.7 /100 | #131 | Exceptional 19.5% |
| Jamaicans | 92.1 /100 | #132 | Exceptional 19.5% |
| Turks | 92.1 /100 | #133 | Exceptional 19.5% |
| Immigrants | North America | 92.1 /100 | #134 | Exceptional 19.5% |
| Soviet Union | 92.0 /100 | #135 | Exceptional 19.5% |
| Russians | 91.5 /100 | #136 | Exceptional 19.5% |
| Austrians | 90.7 /100 | #137 | Exceptional 19.5% |
| Immigrants | Morocco | 89.9 /100 | #138 | Excellent 19.6% |
| Indians (Asian) | 88.3 /100 | #139 | Excellent 19.6% |
| Immigrants | Trinidad and Tobago | 85.6 /100 | #140 | Excellent 19.7% |
| Pennsylvania Germans | 85.5 /100 | #141 | Excellent 19.7% |
| Panamanians | 84.6 /100 | #142 | Excellent 19.7% |
| Slavs | 84.4 /100 | #143 | Excellent 19.7% |
| Immigrants | Northern Africa | 84.1 /100 | #144 | Excellent 19.7% |