Immigrants from Vietnam vs Chickasaw Female Poverty Among 25-34 Year Olds
COMPARE
Immigrants from Vietnam
Chickasaw
Female Poverty Among 25-34 Year Olds
Female Poverty Among 25-34 Year Olds Comparison
Immigrants from Vietnam
Chickasaw
12.3%
FEMALE POVERTY AMONG 25-34 YEAR OLDS
98.9/ 100
METRIC RATING
73rd/ 347
METRIC RANK
17.0%
FEMALE POVERTY AMONG 25-34 YEAR OLDS
0.0/ 100
METRIC RATING
306th/ 347
METRIC RANK
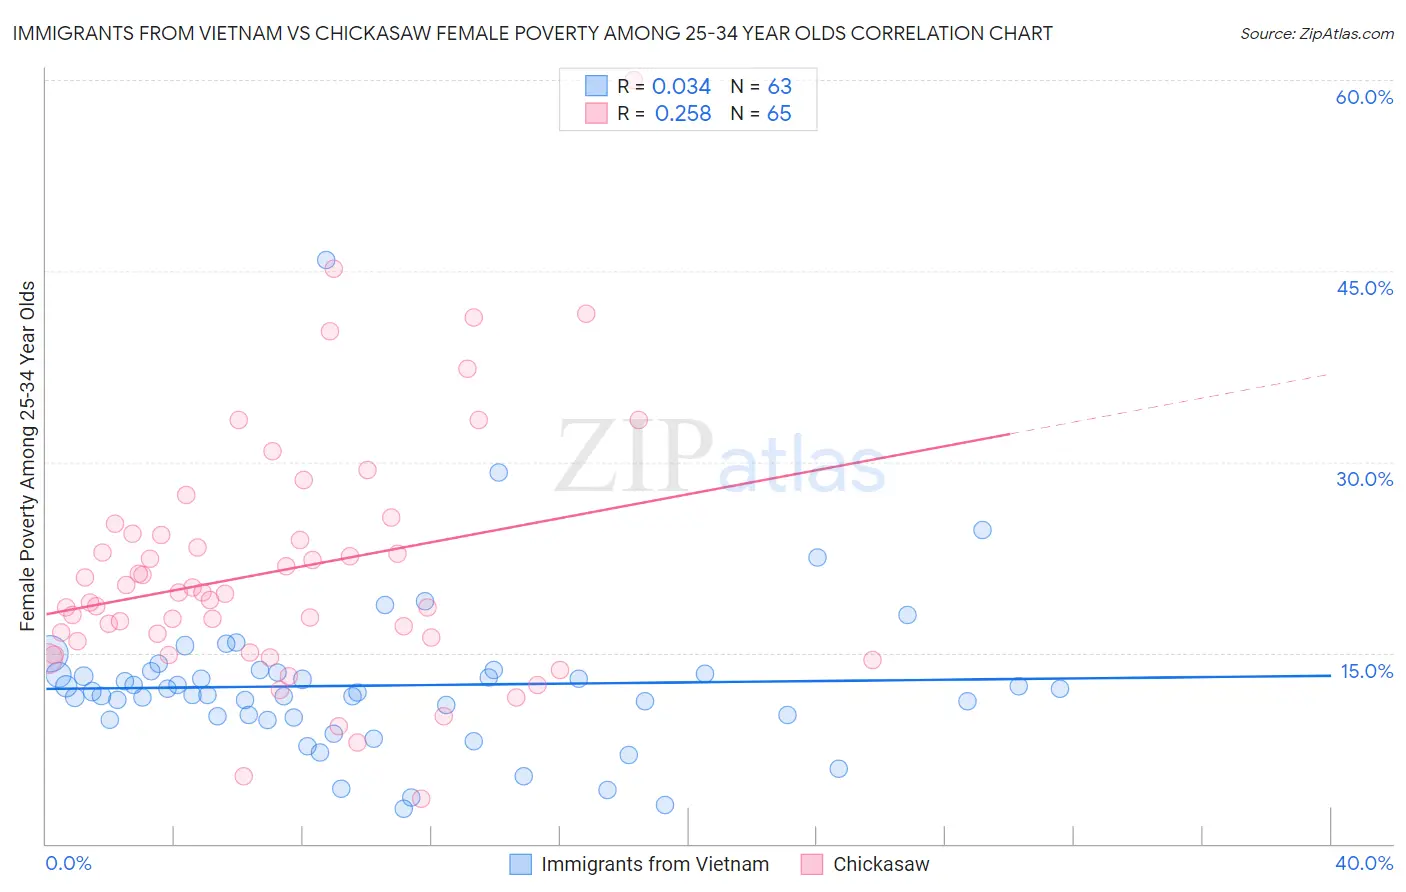
Immigrants from Vietnam vs Chickasaw Female Poverty Among 25-34 Year Olds Correlation Chart
The statistical analysis conducted on geographies consisting of 399,177,676 people shows no correlation between the proportion of Immigrants from Vietnam and poverty level among females between the ages 25 and 34 in the United States with a correlation coefficient (R) of 0.034 and weighted average of 12.3%. Similarly, the statistical analysis conducted on geographies consisting of 147,041,279 people shows a weak positive correlation between the proportion of Chickasaw and poverty level among females between the ages 25 and 34 in the United States with a correlation coefficient (R) of 0.258 and weighted average of 17.0%, a difference of 38.7%.
Female Poverty Among 25-34 Year Olds Correlation Summary
| Measurement | Immigrants from Vietnam | Chickasaw |
| Minimum | 2.7% | 3.5% |
| Maximum | 45.8% | 60.0% |
| Range | 43.1% | 56.5% |
| Mean | 12.4% | 21.5% |
| Median | 11.9% | 19.7% |
| Interquartile 25% (IQ1) | 9.9% | 15.5% |
| Interquartile 75% (IQ3) | 13.4% | 24.3% |
| Interquartile Range (IQR) | 3.5% | 8.8% |
| Standard Deviation (Sample) | 6.3% | 9.8% |
| Standard Deviation (Population) | 6.3% | 9.7% |
Similar Demographics by Female Poverty Among 25-34 Year Olds
Demographics Similar to Immigrants from Vietnam by Female Poverty Among 25-34 Year Olds
In terms of female poverty among 25-34 year olds, the demographic groups most similar to Immigrants from Vietnam are Immigrants from Sweden (12.3%, a difference of 0.030%), Estonian (12.3%, a difference of 0.080%), Greek (12.3%, a difference of 0.14%), Immigrants from Italy (12.3%, a difference of 0.30%), and Lithuanian (12.2%, a difference of 0.31%).
| Demographics | Rating | Rank | Female Poverty Among 25-34 Year Olds |
| Immigrants | Europe | 99.2 /100 | #66 | Exceptional 12.2% |
| Laotians | 99.2 /100 | #67 | Exceptional 12.2% |
| Sri Lankans | 99.1 /100 | #68 | Exceptional 12.2% |
| Immigrants | Lebanon | 99.1 /100 | #69 | Exceptional 12.2% |
| Immigrants | Belgium | 99.1 /100 | #70 | Exceptional 12.2% |
| Immigrants | Scotland | 99.1 /100 | #71 | Exceptional 12.2% |
| Lithuanians | 99.1 /100 | #72 | Exceptional 12.2% |
| Immigrants | Vietnam | 98.9 /100 | #73 | Exceptional 12.3% |
| Immigrants | Sweden | 98.9 /100 | #74 | Exceptional 12.3% |
| Estonians | 98.9 /100 | #75 | Exceptional 12.3% |
| Greeks | 98.9 /100 | #76 | Exceptional 12.3% |
| Immigrants | Italy | 98.8 /100 | #77 | Exceptional 12.3% |
| Immigrants | Ukraine | 98.6 /100 | #78 | Exceptional 12.3% |
| Immigrants | Jordan | 98.5 /100 | #79 | Exceptional 12.4% |
| Immigrants | Malaysia | 98.3 /100 | #80 | Exceptional 12.4% |
Demographics Similar to Chickasaw by Female Poverty Among 25-34 Year Olds
In terms of female poverty among 25-34 year olds, the demographic groups most similar to Chickasaw are Yaqui (17.0%, a difference of 0.020%), African (17.0%, a difference of 0.22%), Ottawa (17.1%, a difference of 0.52%), Immigrants from Cabo Verde (16.9%, a difference of 0.58%), and Honduran (16.9%, a difference of 0.75%).
| Demographics | Rating | Rank | Female Poverty Among 25-34 Year Olds |
| Spanish Americans | 0.0 /100 | #299 | Tragic 16.7% |
| U.S. Virgin Islanders | 0.0 /100 | #300 | Tragic 16.7% |
| Immigrants | Congo | 0.0 /100 | #301 | Tragic 16.7% |
| Alaska Natives | 0.0 /100 | #302 | Tragic 16.8% |
| Immigrants | Mexico | 0.0 /100 | #303 | Tragic 16.8% |
| Hondurans | 0.0 /100 | #304 | Tragic 16.9% |
| Immigrants | Cabo Verde | 0.0 /100 | #305 | Tragic 16.9% |
| Chickasaw | 0.0 /100 | #306 | Tragic 17.0% |
| Yaqui | 0.0 /100 | #307 | Tragic 17.0% |
| Africans | 0.0 /100 | #308 | Tragic 17.0% |
| Ottawa | 0.0 /100 | #309 | Tragic 17.1% |
| Cherokee | 0.0 /100 | #310 | Tragic 17.2% |
| Immigrants | Honduras | 0.0 /100 | #311 | Tragic 17.3% |
| Iroquois | 0.0 /100 | #312 | Tragic 17.5% |
| Colville | 0.0 /100 | #313 | Tragic 17.5% |