Immigrants from Vietnam vs Immigrants from Czechoslovakia Female Poverty Among 25-34 Year Olds
COMPARE
Immigrants from Vietnam
Immigrants from Czechoslovakia
Female Poverty Among 25-34 Year Olds
Female Poverty Among 25-34 Year Olds Comparison
Immigrants from Vietnam
Immigrants from Czechoslovakia
12.3%
FEMALE POVERTY AMONG 25-34 YEAR OLDS
98.9/ 100
METRIC RATING
73rd/ 347
METRIC RANK
12.1%
FEMALE POVERTY AMONG 25-34 YEAR OLDS
99.4/ 100
METRIC RATING
61st/ 347
METRIC RANK
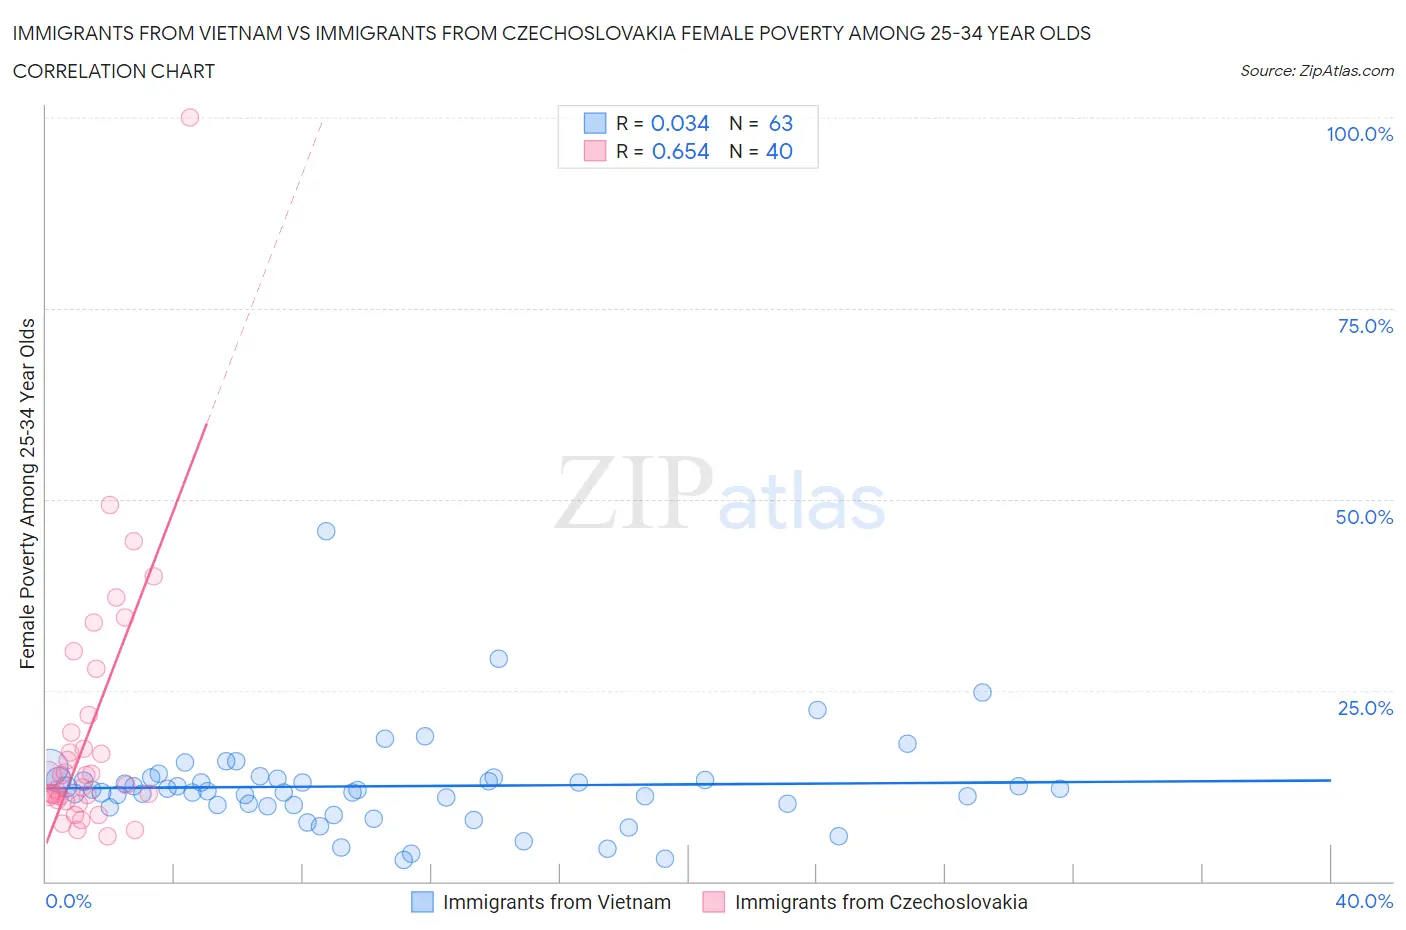
Immigrants from Vietnam vs Immigrants from Czechoslovakia Female Poverty Among 25-34 Year Olds Correlation Chart
The statistical analysis conducted on geographies consisting of 399,177,676 people shows no correlation between the proportion of Immigrants from Vietnam and poverty level among females between the ages 25 and 34 in the United States with a correlation coefficient (R) of 0.034 and weighted average of 12.3%. Similarly, the statistical analysis conducted on geographies consisting of 193,241,003 people shows a significant positive correlation between the proportion of Immigrants from Czechoslovakia and poverty level among females between the ages 25 and 34 in the United States with a correlation coefficient (R) of 0.654 and weighted average of 12.1%, a difference of 1.3%.
Female Poverty Among 25-34 Year Olds Correlation Summary
| Measurement | Immigrants from Vietnam | Immigrants from Czechoslovakia |
| Minimum | 2.7% | 5.8% |
| Maximum | 45.8% | 100.0% |
| Range | 43.1% | 94.2% |
| Mean | 12.4% | 19.4% |
| Median | 11.9% | 13.2% |
| Interquartile 25% (IQ1) | 9.9% | 10.9% |
| Interquartile 75% (IQ3) | 13.4% | 20.6% |
| Interquartile Range (IQR) | 3.5% | 9.7% |
| Standard Deviation (Sample) | 6.3% | 17.1% |
| Standard Deviation (Population) | 6.3% | 16.9% |
Demographics Similar to Immigrants from Vietnam and Immigrants from Czechoslovakia by Female Poverty Among 25-34 Year Olds
In terms of female poverty among 25-34 year olds, the demographic groups most similar to Immigrants from Vietnam are Immigrants from Sweden (12.3%, a difference of 0.030%), Estonian (12.3%, a difference of 0.080%), Greek (12.3%, a difference of 0.14%), Immigrants from Italy (12.3%, a difference of 0.30%), and Lithuanian (12.2%, a difference of 0.31%). Similarly, the demographic groups most similar to Immigrants from Czechoslovakia are Immigrants from Northern Europe (12.1%, a difference of 0.020%), Immigrants from Romania (12.1%, a difference of 0.11%), Russian (12.1%, a difference of 0.11%), Immigrants from Moldova (12.1%, a difference of 0.17%), and Soviet Union (12.1%, a difference of 0.18%).
| Demographics | Rating | Rank | Female Poverty Among 25-34 Year Olds |
| Jordanians | 99.4 /100 | #57 | Exceptional 12.1% |
| Immigrants | Romania | 99.4 /100 | #58 | Exceptional 12.1% |
| Russians | 99.4 /100 | #59 | Exceptional 12.1% |
| Immigrants | Northern Europe | 99.4 /100 | #60 | Exceptional 12.1% |
| Immigrants | Czechoslovakia | 99.4 /100 | #61 | Exceptional 12.1% |
| Immigrants | Moldova | 99.3 /100 | #62 | Exceptional 12.1% |
| Soviet Union | 99.3 /100 | #63 | Exceptional 12.1% |
| Immigrants | Russia | 99.2 /100 | #64 | Exceptional 12.2% |
| Armenians | 99.2 /100 | #65 | Exceptional 12.2% |
| Immigrants | Europe | 99.2 /100 | #66 | Exceptional 12.2% |
| Laotians | 99.2 /100 | #67 | Exceptional 12.2% |
| Sri Lankans | 99.1 /100 | #68 | Exceptional 12.2% |
| Immigrants | Lebanon | 99.1 /100 | #69 | Exceptional 12.2% |
| Immigrants | Belgium | 99.1 /100 | #70 | Exceptional 12.2% |
| Immigrants | Scotland | 99.1 /100 | #71 | Exceptional 12.2% |
| Lithuanians | 99.1 /100 | #72 | Exceptional 12.2% |
| Immigrants | Vietnam | 98.9 /100 | #73 | Exceptional 12.3% |
| Immigrants | Sweden | 98.9 /100 | #74 | Exceptional 12.3% |
| Estonians | 98.9 /100 | #75 | Exceptional 12.3% |
| Greeks | 98.9 /100 | #76 | Exceptional 12.3% |
| Immigrants | Italy | 98.8 /100 | #77 | Exceptional 12.3% |