Bahamian vs Chickasaw Female Poverty Among 25-34 Year Olds
COMPARE
Bahamian
Chickasaw
Female Poverty Among 25-34 Year Olds
Female Poverty Among 25-34 Year Olds Comparison
Bahamians
Chickasaw
16.1%
FEMALE POVERTY AMONG 25-34 YEAR OLDS
0.0/ 100
METRIC RATING
283rd/ 347
METRIC RANK
17.0%
FEMALE POVERTY AMONG 25-34 YEAR OLDS
0.0/ 100
METRIC RATING
306th/ 347
METRIC RANK
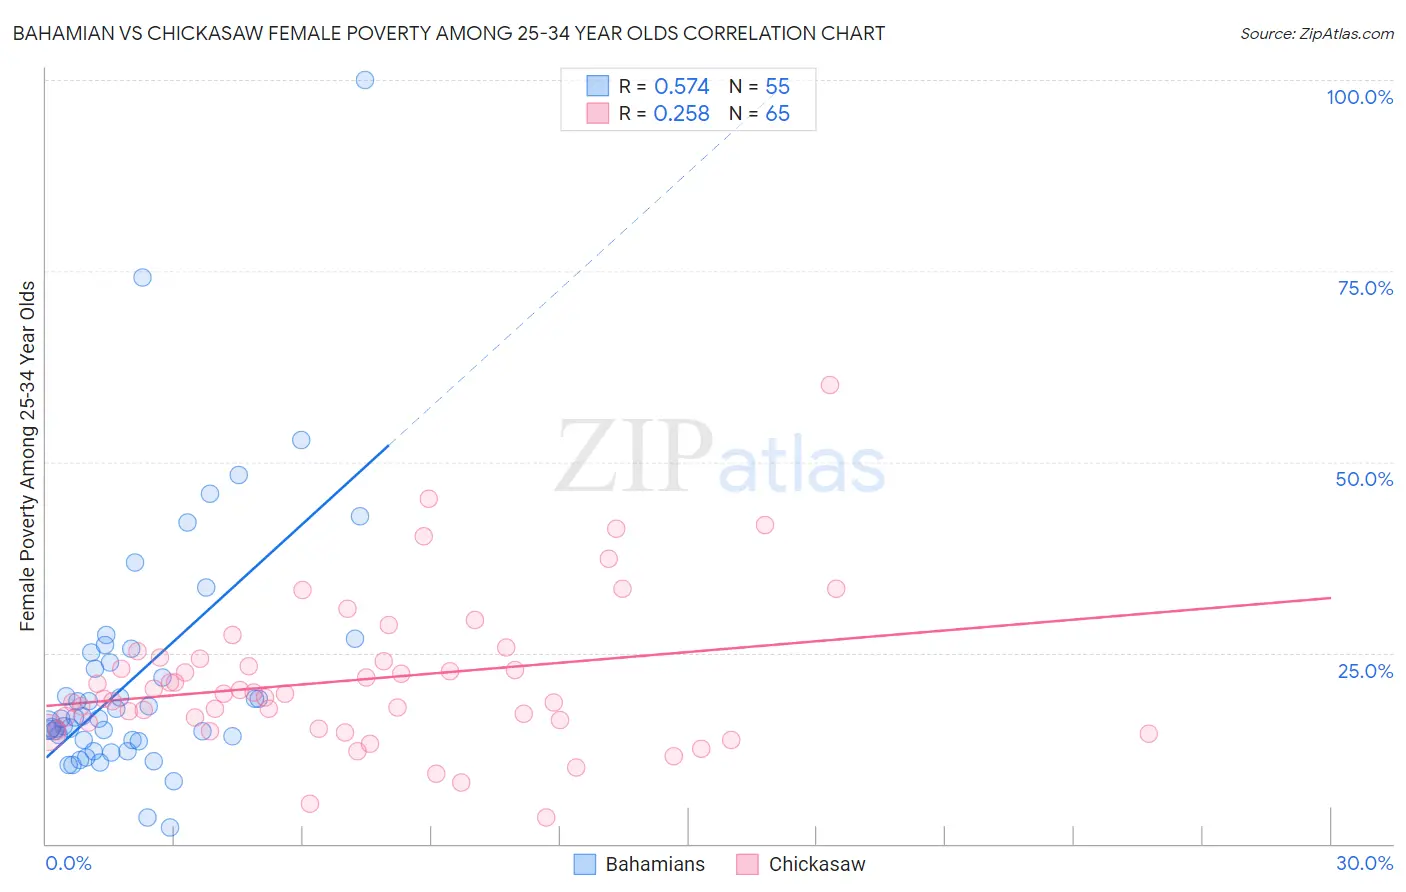
Bahamian vs Chickasaw Female Poverty Among 25-34 Year Olds Correlation Chart
The statistical analysis conducted on geographies consisting of 112,200,986 people shows a substantial positive correlation between the proportion of Bahamians and poverty level among females between the ages 25 and 34 in the United States with a correlation coefficient (R) of 0.574 and weighted average of 16.1%. Similarly, the statistical analysis conducted on geographies consisting of 147,041,279 people shows a weak positive correlation between the proportion of Chickasaw and poverty level among females between the ages 25 and 34 in the United States with a correlation coefficient (R) of 0.258 and weighted average of 17.0%, a difference of 5.7%.
Female Poverty Among 25-34 Year Olds Correlation Summary
| Measurement | Bahamian | Chickasaw |
| Minimum | 2.1% | 3.5% |
| Maximum | 100.0% | 60.0% |
| Range | 97.9% | 56.5% |
| Mean | 22.0% | 21.5% |
| Median | 16.4% | 19.7% |
| Interquartile 25% (IQ1) | 13.6% | 15.5% |
| Interquartile 75% (IQ3) | 25.1% | 24.3% |
| Interquartile Range (IQR) | 11.5% | 8.8% |
| Standard Deviation (Sample) | 16.8% | 9.8% |
| Standard Deviation (Population) | 16.7% | 9.7% |
Similar Demographics by Female Poverty Among 25-34 Year Olds
Demographics Similar to Bahamians by Female Poverty Among 25-34 Year Olds
In terms of female poverty among 25-34 year olds, the demographic groups most similar to Bahamians are Aleut (16.1%, a difference of 0.030%), Immigrants from Latin America (16.0%, a difference of 0.69%), Shoshone (16.2%, a difference of 0.83%), Bangladeshi (15.9%, a difference of 1.2%), and Immigrants from Bahamas (16.3%, a difference of 1.3%).
| Demographics | Rating | Rank | Female Poverty Among 25-34 Year Olds |
| Immigrants | Zaire | 0.0 /100 | #276 | Tragic 15.8% |
| Immigrants | Micronesia | 0.0 /100 | #277 | Tragic 15.8% |
| French American Indians | 0.0 /100 | #278 | Tragic 15.9% |
| Fijians | 0.0 /100 | #279 | Tragic 15.9% |
| Bangladeshis | 0.0 /100 | #280 | Tragic 15.9% |
| Immigrants | Latin America | 0.0 /100 | #281 | Tragic 16.0% |
| Aleuts | 0.0 /100 | #282 | Tragic 16.1% |
| Bahamians | 0.0 /100 | #283 | Tragic 16.1% |
| Shoshone | 0.0 /100 | #284 | Tragic 16.2% |
| Immigrants | Bahamas | 0.0 /100 | #285 | Tragic 16.3% |
| Cape Verdeans | 0.0 /100 | #286 | Tragic 16.3% |
| Americans | 0.0 /100 | #287 | Tragic 16.4% |
| Guatemalans | 0.0 /100 | #288 | Tragic 16.4% |
| Osage | 0.0 /100 | #289 | Tragic 16.4% |
| Indonesians | 0.0 /100 | #290 | Tragic 16.4% |
Demographics Similar to Chickasaw by Female Poverty Among 25-34 Year Olds
In terms of female poverty among 25-34 year olds, the demographic groups most similar to Chickasaw are Yaqui (17.0%, a difference of 0.020%), African (17.0%, a difference of 0.22%), Ottawa (17.1%, a difference of 0.52%), Immigrants from Cabo Verde (16.9%, a difference of 0.58%), and Honduran (16.9%, a difference of 0.75%).
| Demographics | Rating | Rank | Female Poverty Among 25-34 Year Olds |
| Spanish Americans | 0.0 /100 | #299 | Tragic 16.7% |
| U.S. Virgin Islanders | 0.0 /100 | #300 | Tragic 16.7% |
| Immigrants | Congo | 0.0 /100 | #301 | Tragic 16.7% |
| Alaska Natives | 0.0 /100 | #302 | Tragic 16.8% |
| Immigrants | Mexico | 0.0 /100 | #303 | Tragic 16.8% |
| Hondurans | 0.0 /100 | #304 | Tragic 16.9% |
| Immigrants | Cabo Verde | 0.0 /100 | #305 | Tragic 16.9% |
| Chickasaw | 0.0 /100 | #306 | Tragic 17.0% |
| Yaqui | 0.0 /100 | #307 | Tragic 17.0% |
| Africans | 0.0 /100 | #308 | Tragic 17.0% |
| Ottawa | 0.0 /100 | #309 | Tragic 17.1% |
| Cherokee | 0.0 /100 | #310 | Tragic 17.2% |
| Immigrants | Honduras | 0.0 /100 | #311 | Tragic 17.3% |
| Iroquois | 0.0 /100 | #312 | Tragic 17.5% |
| Colville | 0.0 /100 | #313 | Tragic 17.5% |