Immigrants from Uzbekistan vs Bolivian Female Poverty Among 18-24 Year Olds
COMPARE
Immigrants from Uzbekistan
Bolivian
Female Poverty Among 18-24 Year Olds
Female Poverty Among 18-24 Year Olds Comparison
Immigrants from Uzbekistan
Bolivians
19.2%
FEMALE POVERTY AMONG 18-24 YEAR OLDS
97.3/ 100
METRIC RATING
108th/ 347
METRIC RANK
17.4%
FEMALE POVERTY AMONG 18-24 YEAR OLDS
100.0/ 100
METRIC RATING
21st/ 347
METRIC RANK
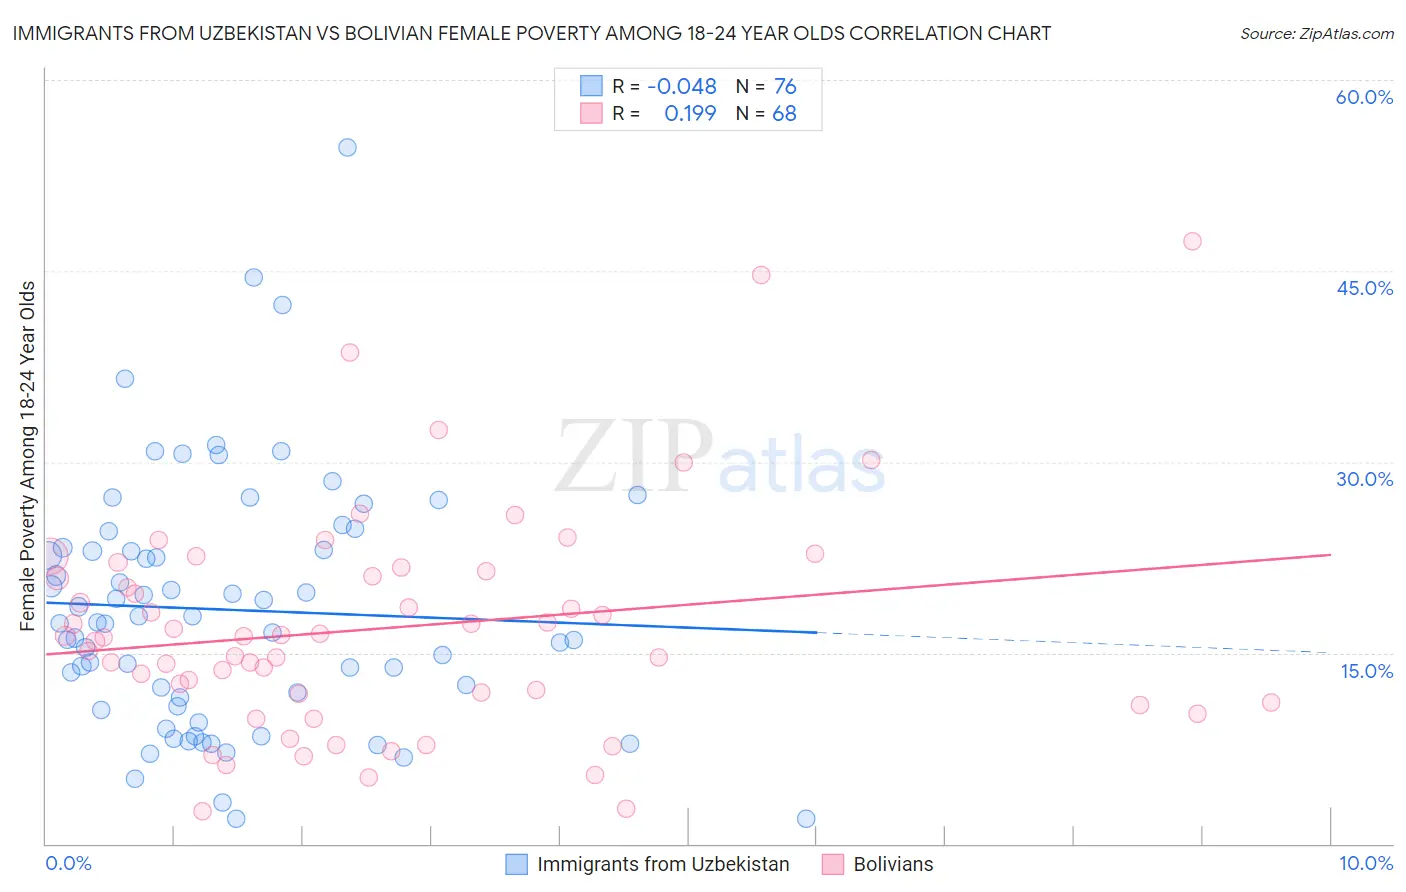
Immigrants from Uzbekistan vs Bolivian Female Poverty Among 18-24 Year Olds Correlation Chart
The statistical analysis conducted on geographies consisting of 117,709,587 people shows no correlation between the proportion of Immigrants from Uzbekistan and poverty level among females between the ages 18 and 24 in the United States with a correlation coefficient (R) of -0.048 and weighted average of 19.2%. Similarly, the statistical analysis conducted on geographies consisting of 182,623,221 people shows a poor positive correlation between the proportion of Bolivians and poverty level among females between the ages 18 and 24 in the United States with a correlation coefficient (R) of 0.199 and weighted average of 17.4%, a difference of 10.2%.
Female Poverty Among 18-24 Year Olds Correlation Summary
| Measurement | Immigrants from Uzbekistan | Bolivian |
| Minimum | 2.0% | 2.6% |
| Maximum | 54.7% | 47.4% |
| Range | 52.8% | 44.8% |
| Mean | 18.4% | 16.9% |
| Median | 17.4% | 16.2% |
| Interquartile 25% (IQ1) | 11.2% | 11.4% |
| Interquartile 75% (IQ3) | 23.2% | 21.2% |
| Interquartile Range (IQR) | 12.0% | 9.8% |
| Standard Deviation (Sample) | 9.8% | 8.7% |
| Standard Deviation (Population) | 9.8% | 8.7% |
Similar Demographics by Female Poverty Among 18-24 Year Olds
Demographics Similar to Immigrants from Uzbekistan by Female Poverty Among 18-24 Year Olds
In terms of female poverty among 18-24 year olds, the demographic groups most similar to Immigrants from Uzbekistan are Immigrants from Syria (19.2%, a difference of 0.080%), Immigrants from Sri Lanka (19.2%, a difference of 0.090%), Laotian (19.2%, a difference of 0.11%), Immigrants from Serbia (19.2%, a difference of 0.12%), and Immigrants from Sierra Leone (19.2%, a difference of 0.24%).
| Demographics | Rating | Rank | Female Poverty Among 18-24 Year Olds |
| Ecuadorians | 98.1 /100 | #101 | Exceptional 19.1% |
| Immigrants | Caribbean | 98.1 /100 | #102 | Exceptional 19.1% |
| Serbians | 98.0 /100 | #103 | Exceptional 19.1% |
| Immigrants | Afghanistan | 98.0 /100 | #104 | Exceptional 19.1% |
| Immigrants | Ecuador | 97.8 /100 | #105 | Exceptional 19.2% |
| Immigrants | Sierra Leone | 97.8 /100 | #106 | Exceptional 19.2% |
| Immigrants | Sri Lanka | 97.5 /100 | #107 | Exceptional 19.2% |
| Immigrants | Uzbekistan | 97.3 /100 | #108 | Exceptional 19.2% |
| Immigrants | Syria | 97.2 /100 | #109 | Exceptional 19.2% |
| Laotians | 97.1 /100 | #110 | Exceptional 19.2% |
| Immigrants | Serbia | 97.1 /100 | #111 | Exceptional 19.2% |
| Immigrants | El Salvador | 96.5 /100 | #112 | Exceptional 19.3% |
| Immigrants | Cameroon | 96.3 /100 | #113 | Exceptional 19.3% |
| Slovenes | 96.2 /100 | #114 | Exceptional 19.3% |
| Immigrants | Hungary | 96.2 /100 | #115 | Exceptional 19.3% |
Demographics Similar to Bolivians by Female Poverty Among 18-24 Year Olds
In terms of female poverty among 18-24 year olds, the demographic groups most similar to Bolivians are Immigrants from Venezuela (17.4%, a difference of 0.0%), Immigrants from Hong Kong (17.5%, a difference of 0.10%), Immigrants from Lithuania (17.4%, a difference of 0.13%), Immigrants from Colombia (17.3%, a difference of 0.54%), and Immigrants from North Macedonia (17.6%, a difference of 0.67%).
| Demographics | Rating | Rank | Female Poverty Among 18-24 Year Olds |
| Tongans | 100.0 /100 | #14 | Exceptional 17.1% |
| Cubans | 100.0 /100 | #15 | Exceptional 17.2% |
| Peruvians | 100.0 /100 | #16 | Exceptional 17.2% |
| Immigrants | Taiwan | 100.0 /100 | #17 | Exceptional 17.3% |
| Immigrants | Colombia | 100.0 /100 | #18 | Exceptional 17.3% |
| Immigrants | Lithuania | 100.0 /100 | #19 | Exceptional 17.4% |
| Immigrants | Venezuela | 100.0 /100 | #20 | Exceptional 17.4% |
| Bolivians | 100.0 /100 | #21 | Exceptional 17.4% |
| Immigrants | Hong Kong | 100.0 /100 | #22 | Exceptional 17.5% |
| Immigrants | North Macedonia | 100.0 /100 | #23 | Exceptional 17.6% |
| Maltese | 100.0 /100 | #24 | Exceptional 17.6% |
| Immigrants | South Central Asia | 100.0 /100 | #25 | Exceptional 17.6% |
| Immigrants | Fiji | 100.0 /100 | #26 | Exceptional 17.7% |
| Colombians | 100.0 /100 | #27 | Exceptional 17.7% |
| Venezuelans | 100.0 /100 | #28 | Exceptional 17.7% |