Immigrants from Uzbekistan vs Nigerian Female Poverty Among 18-24 Year Olds
COMPARE
Immigrants from Uzbekistan
Nigerian
Female Poverty Among 18-24 Year Olds
Female Poverty Among 18-24 Year Olds Comparison
Immigrants from Uzbekistan
Nigerians
19.2%
FEMALE POVERTY AMONG 18-24 YEAR OLDS
97.3/ 100
METRIC RATING
108th/ 347
METRIC RANK
20.4%
FEMALE POVERTY AMONG 18-24 YEAR OLDS
23.4/ 100
METRIC RATING
193rd/ 347
METRIC RANK
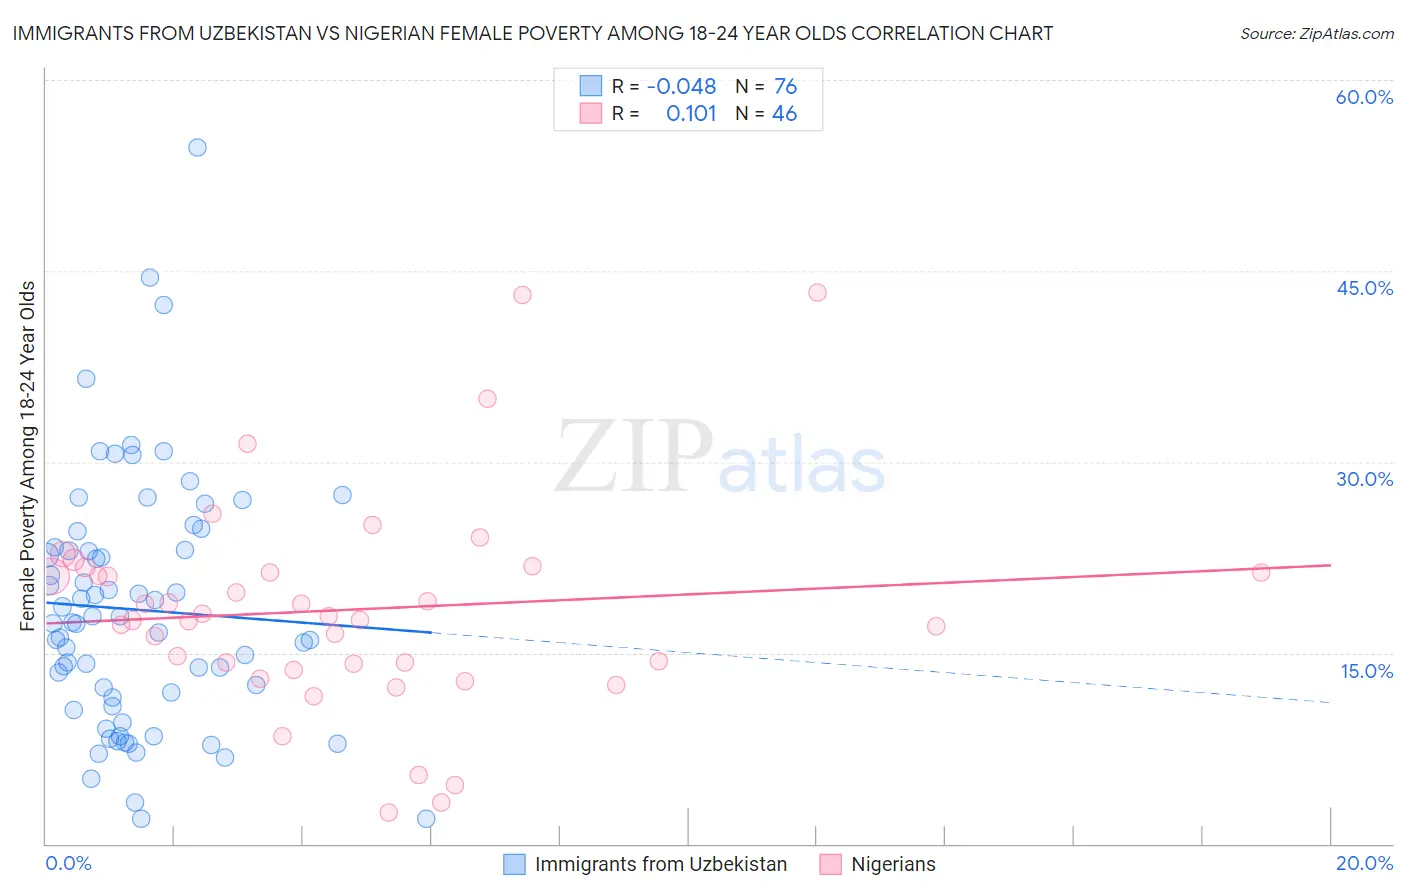
Immigrants from Uzbekistan vs Nigerian Female Poverty Among 18-24 Year Olds Correlation Chart
The statistical analysis conducted on geographies consisting of 117,709,587 people shows no correlation between the proportion of Immigrants from Uzbekistan and poverty level among females between the ages 18 and 24 in the United States with a correlation coefficient (R) of -0.048 and weighted average of 19.2%. Similarly, the statistical analysis conducted on geographies consisting of 327,876,042 people shows a poor positive correlation between the proportion of Nigerians and poverty level among females between the ages 18 and 24 in the United States with a correlation coefficient (R) of 0.101 and weighted average of 20.4%, a difference of 6.1%.
Female Poverty Among 18-24 Year Olds Correlation Summary
| Measurement | Immigrants from Uzbekistan | Nigerian |
| Minimum | 2.0% | 2.5% |
| Maximum | 54.7% | 43.3% |
| Range | 52.8% | 40.9% |
| Mean | 18.4% | 18.4% |
| Median | 17.4% | 17.7% |
| Interquartile 25% (IQ1) | 11.2% | 14.2% |
| Interquartile 75% (IQ3) | 23.2% | 21.4% |
| Interquartile Range (IQR) | 12.0% | 7.2% |
| Standard Deviation (Sample) | 9.8% | 8.4% |
| Standard Deviation (Population) | 9.8% | 8.3% |
Similar Demographics by Female Poverty Among 18-24 Year Olds
Demographics Similar to Immigrants from Uzbekistan by Female Poverty Among 18-24 Year Olds
In terms of female poverty among 18-24 year olds, the demographic groups most similar to Immigrants from Uzbekistan are Immigrants from Syria (19.2%, a difference of 0.080%), Immigrants from Sri Lanka (19.2%, a difference of 0.090%), Laotian (19.2%, a difference of 0.11%), Immigrants from Serbia (19.2%, a difference of 0.12%), and Immigrants from Sierra Leone (19.2%, a difference of 0.24%).
| Demographics | Rating | Rank | Female Poverty Among 18-24 Year Olds |
| Ecuadorians | 98.1 /100 | #101 | Exceptional 19.1% |
| Immigrants | Caribbean | 98.1 /100 | #102 | Exceptional 19.1% |
| Serbians | 98.0 /100 | #103 | Exceptional 19.1% |
| Immigrants | Afghanistan | 98.0 /100 | #104 | Exceptional 19.1% |
| Immigrants | Ecuador | 97.8 /100 | #105 | Exceptional 19.2% |
| Immigrants | Sierra Leone | 97.8 /100 | #106 | Exceptional 19.2% |
| Immigrants | Sri Lanka | 97.5 /100 | #107 | Exceptional 19.2% |
| Immigrants | Uzbekistan | 97.3 /100 | #108 | Exceptional 19.2% |
| Immigrants | Syria | 97.2 /100 | #109 | Exceptional 19.2% |
| Laotians | 97.1 /100 | #110 | Exceptional 19.2% |
| Immigrants | Serbia | 97.1 /100 | #111 | Exceptional 19.2% |
| Immigrants | El Salvador | 96.5 /100 | #112 | Exceptional 19.3% |
| Immigrants | Cameroon | 96.3 /100 | #113 | Exceptional 19.3% |
| Slovenes | 96.2 /100 | #114 | Exceptional 19.3% |
| Immigrants | Hungary | 96.2 /100 | #115 | Exceptional 19.3% |
Demographics Similar to Nigerians by Female Poverty Among 18-24 Year Olds
In terms of female poverty among 18-24 year olds, the demographic groups most similar to Nigerians are Mexican American Indian (20.4%, a difference of 0.010%), Immigrants from Latvia (20.4%, a difference of 0.030%), Immigrants from Israel (20.4%, a difference of 0.070%), Czech (20.4%, a difference of 0.070%), and Moroccan (20.4%, a difference of 0.16%).
| Demographics | Rating | Rank | Female Poverty Among 18-24 Year Olds |
| Immigrants | Ethiopia | 37.3 /100 | #186 | Fair 20.2% |
| Immigrants | Mexico | 36.3 /100 | #187 | Fair 20.2% |
| Scandinavians | 34.6 /100 | #188 | Fair 20.3% |
| Immigrants | Germany | 34.0 /100 | #189 | Fair 20.3% |
| Immigrants | Western Asia | 29.3 /100 | #190 | Fair 20.3% |
| Moroccans | 25.8 /100 | #191 | Fair 20.4% |
| Immigrants | Israel | 24.4 /100 | #192 | Fair 20.4% |
| Nigerians | 23.4 /100 | #193 | Fair 20.4% |
| Mexican American Indians | 23.2 /100 | #194 | Fair 20.4% |
| Immigrants | Latvia | 23.0 /100 | #195 | Fair 20.4% |
| Czechs | 22.3 /100 | #196 | Fair 20.4% |
| Zimbabweans | 21.0 /100 | #197 | Fair 20.4% |
| Immigrants | Spain | 20.7 /100 | #198 | Fair 20.4% |
| Germans | 20.6 /100 | #199 | Fair 20.4% |
| Europeans | 19.9 /100 | #200 | Poor 20.4% |